RSView Supervisory Edition Installation Guide
RSView Supervisory Edition Installation Guide
RSView Supervisory Edition Installation Guide
- No tags were found...
Create successful ePaper yourself
Turn your PDF publications into a flip-book with our unique Google optimized e-Paper software.
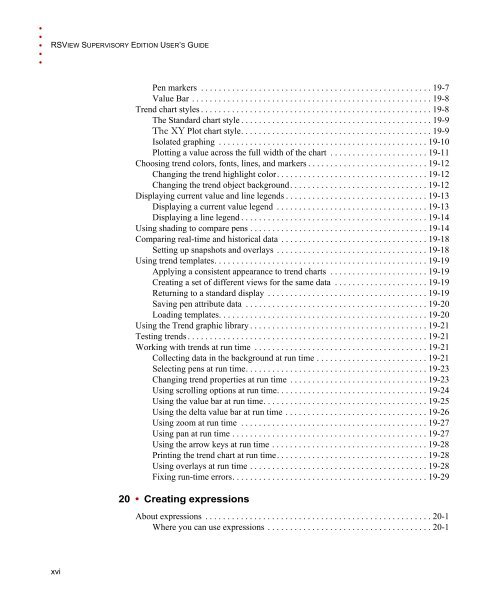
• • • • •RSVIEW SUPERVISORY EDITION USER’S GUIDEPen markers . . . . . . . . . . . . . . . . . . . . . . . . . . . . . . . . . . . . . . . . . . . . . . . . . . . . 19-7Value Bar . . . . . . . . . . . . . . . . . . . . . . . . . . . . . . . . . . . . . . . . . . . . . . . . . . . . . . 19-8Trend chart styles . . . . . . . . . . . . . . . . . . . . . . . . . . . . . . . . . . . . . . . . . . . . . . . . . . . . 19-8The Standard chart style . . . . . . . . . . . . . . . . . . . . . . . . . . . . . . . . . . . . . . . . . . . 19-9The XY Plot chart style. . . . . . . . . . . . . . . . . . . . . . . . . . . . . . . . . . . . . . . . . . . 19-9Isolated graphing . . . . . . . . . . . . . . . . . . . . . . . . . . . . . . . . . . . . . . . . . . . . . . . 19-10Plotting a value across the full width of the chart . . . . . . . . . . . . . . . . . . . . . . 19-11Choosing trend colors, fonts, lines, and markers . . . . . . . . . . . . . . . . . . . . . . . . . . . 19-12Changing the trend highlight color. . . . . . . . . . . . . . . . . . . . . . . . . . . . . . . . . . 19-12Changing the trend object background. . . . . . . . . . . . . . . . . . . . . . . . . . . . . . . 19-12Displaying current value and line legends . . . . . . . . . . . . . . . . . . . . . . . . . . . . . . . . 19-13Displaying a current value legend . . . . . . . . . . . . . . . . . . . . . . . . . . . . . . . . . . 19-13Displaying a line legend . . . . . . . . . . . . . . . . . . . . . . . . . . . . . . . . . . . . . . . . . . 19-14Using shading to compare pens . . . . . . . . . . . . . . . . . . . . . . . . . . . . . . . . . . . . . . . . 19-14Comparing real-time and historical data . . . . . . . . . . . . . . . . . . . . . . . . . . . . . . . . . 19-18Setting up snapshots and overlays . . . . . . . . . . . . . . . . . . . . . . . . . . . . . . . . . . 19-18Using trend templates. . . . . . . . . . . . . . . . . . . . . . . . . . . . . . . . . . . . . . . . . . . . . . . . 19-19Applying a consistent appearance to trend charts . . . . . . . . . . . . . . . . . . . . . . 19-19Creating a set of different views for the same data . . . . . . . . . . . . . . . . . . . . . 19-19Returning to a standard display . . . . . . . . . . . . . . . . . . . . . . . . . . . . . . . . . . . . 19-19Saving pen attribute data . . . . . . . . . . . . . . . . . . . . . . . . . . . . . . . . . . . . . . . . . 19-20Loading templates. . . . . . . . . . . . . . . . . . . . . . . . . . . . . . . . . . . . . . . . . . . . . . . 19-20Using the Trend graphic library . . . . . . . . . . . . . . . . . . . . . . . . . . . . . . . . . . . . . . . . 19-21Testing trends . . . . . . . . . . . . . . . . . . . . . . . . . . . . . . . . . . . . . . . . . . . . . . . . . . . . . . 19-21Working with trends at run time . . . . . . . . . . . . . . . . . . . . . . . . . . . . . . . . . . . . . . . 19-21Collecting data in the background at run time . . . . . . . . . . . . . . . . . . . . . . . . . 19-21Selecting pens at run time. . . . . . . . . . . . . . . . . . . . . . . . . . . . . . . . . . . . . . . . . 19-23Changing trend properties at run time . . . . . . . . . . . . . . . . . . . . . . . . . . . . . . . 19-23Using scrolling options at run time. . . . . . . . . . . . . . . . . . . . . . . . . . . . . . . . . . 19-24Using the value bar at run time. . . . . . . . . . . . . . . . . . . . . . . . . . . . . . . . . . . . . 19-25Using the delta value bar at run time . . . . . . . . . . . . . . . . . . . . . . . . . . . . . . . . 19-26Using zoom at run time . . . . . . . . . . . . . . . . . . . . . . . . . . . . . . . . . . . . . . . . . . 19-27Using pan at run time . . . . . . . . . . . . . . . . . . . . . . . . . . . . . . . . . . . . . . . . . . . . 19-27Using the arrow keys at run time . . . . . . . . . . . . . . . . . . . . . . . . . . . . . . . . . . . 19-28Printing the trend chart at run time. . . . . . . . . . . . . . . . . . . . . . . . . . . . . . . . . . 19-28Using overlays at run time . . . . . . . . . . . . . . . . . . . . . . . . . . . . . . . . . . . . . . . . 19-28Fixing run-time errors. . . . . . . . . . . . . . . . . . . . . . . . . . . . . . . . . . . . . . . . . . . . 19-2920 • Creating expressionsAbout expressions . . . . . . . . . . . . . . . . . . . . . . . . . . . . . . . . . . . . . . . . . . . . . . . . . . . 20-1Where you can use expressions . . . . . . . . . . . . . . . . . . . . . . . . . . . . . . . . . . . . . 20-1xvi


