June 29, 2001 ■ <strong>Model</strong> Transit-Oriented District Overlay <strong>Zoning</strong> <strong>Ordinance</strong>2.5 Mixed-use <strong>TOD</strong> can generate strong sales taxrevenues.<strong>TOD</strong>s on both coasts have brought added revenues to cities and counties that heavily depend on asales tax for revenues. WMATA’s Pentagon City Fashion Center, located southwest ofWashington, D.C., was developed in the early 1990s. The management overseeing the mall’soperation estimates that over 50 % of shoppers and customers arrive by Metrorail, generating afair amount of sales tax revenue for Arlington County. According to Cervero, “many are federalworkers who come from the district e.g., the Federal Triangle area during lunch hour, a 5- to 10-min train ride away.” H However, <strong>TOD</strong>s along region-serving systems such as BART andWMATA, should be selective in the types of retail they attract. In several cases around thecountry, big-box retail has been built in close proximity to transit stops. While these uses maygenerate sales tax they do not generate many transit trips given the size and bulk of most of theirstock. Examples are located along the BART system, in Denver, and San Diego.2.6 Mixed-use <strong>TOD</strong>s can deliver more highly-valueddevelopment.Basic economic theory suggests that land values should be higher within <strong>TOD</strong>s than in similarareas that do not have transit access. Whether the development is housing, retail, or employment,improved access should increase the value of development. Studies, since the earliest days ofeconomic theory, have shown that land values increase as one moves closer to centers ofeconomic activity (Central Business Districts or in many areas today in “Suburban Clusters”). I Inmost regions, the primary rationale for this is the personal and real costs associated with commutetime. Living within convenient access to an economic activity center (employment) involves ashorter, less costly commute. But land values are typically higher in these areas compared toareas farther from the activity center. While living farther out carries the added burden of a longercommute, this economic and quality of life tradeoff is a fundamental concept driving urban landvalues. JTransit-Oriented Developments, as both portals to economic activity centers along transit linesand as potential economic activity centers themselves, should also respond to this pattern ofincreasing land value. Based on enhanced transportation systems, <strong>TOD</strong>s lower the personal andreal costs of commuting through improved convenience, and reduced travel times and costs forHBernick and Cervero 231.IElizabeth A. Deakin, “Jobs, Housing, and Transportation: Theory and Evidence on Interactionsbetween Land Use and Transportation,” Special Report 231: Transportation, Urban Form and theEnvironment (Washington, DC: Transportation Research Board, National Research Council, 1991) 27.JRobert T. Dunphy found that Southern California home buyers are willing to travel another 15 to 30minutes to shave $10 to $15 per square foot off the price of their house. Additionally, in comparing pairs ofcounterpart homes of similar quality and size, on a similar lot, Southern California home buyers werewilling to pay between 2.5 and 4.4% more for each mile the home was located closer to an employmentcenter, and between 1.6 and 3.5% more for every minute their commute time was reduced. Robert T.Dunphy, “The Cost of Being Close: Land Values and Housing Prices in Portland’s High-Tech Corridor,”Working Paper 660 (Washington, DC: Urban Land Institute, 1998).Page 10 ■Chapter II ■ Valley Connections
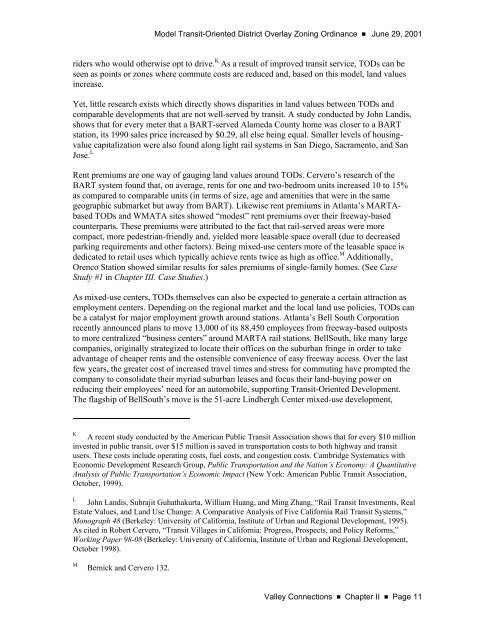
<strong>Model</strong> Transit-Oriented District Overlay <strong>Zoning</strong> <strong>Ordinance</strong> ■ June 29, 2001riders who would otherwise opt to drive. K As a result of improved transit service, <strong>TOD</strong>s can beseen as points or zones where commute costs are reduced and, based on this model, land valuesincrease.Yet, little research exists which directly shows disparities in land values between <strong>TOD</strong>s andcomparable developments that are not well-served by transit. A study conducted by John Landis,shows that for every meter that a BART-served Alameda County home was closer to a BARTstation, its 1990 sales price increased by $0.29, all else being equal. Smaller levels of housingvaluecapitalization were also found along light rail systems in San Diego, Sacramento, and SanJose. LRent premiums are one way of gauging land values around <strong>TOD</strong>s. Cervero’s research of theBART system found that, on average, rents for one and two-bedroom units increased 10 to 15%as compared to comparable units (in terms of size, age and amenities that were in the samegeographic submarket but away from BART). Likewise rent premiums in Atlanta’s MARTAbased<strong>TOD</strong>s and WMATA sites showed “modest” rent premiums over their freeway-basedcounterparts. These premiums were attributed to the fact that rail-served areas were morecompact, more pedestrian-friendly and, yielded more leasable space overall (due to decreasedparking requirements and other factors). Being mixed-use centers more of the leasable space isdedicated to retail uses which typically achieve rents twice as high as office. M Additionally,Orenco Station showed similar results for sales premiums of single-family homes. (See CaseStudy #1 in Chapter III. Case Studies.)As mixed-use centers, <strong>TOD</strong>s themselves can also be expected to generate a certain attraction asemployment centers. Depending on the regional market and the local land use policies, <strong>TOD</strong>s canbe a catalyst for major employment growth around stations. Atlanta’s Bell South Corporationrecently announced plans to move 13,000 of its 88,450 employees from freeway-based outpoststo more centralized “business centers” around MARTA rail stations. BellSouth, like many largecompanies, originally strategized to locate their offices on the suburban fringe in order to takeadvantage of cheaper rents and the ostensible convenience of easy freeway access. Over the lastfew years, the greater cost of increased travel times and stress for commuting have prompted thecompany to consolidate their myriad suburban leases and focus their land-buying power onreducing their employees’ need for an automobile, supporting Transit-Oriented Development.The flagship of BellSouth’s move is the 51-acre Lindbergh Center mixed-use development,KA recent study conducted by the <strong>America</strong>n Public Transit Association shows that for every $10 millioninvested in public transit, over $15 million is saved in transportation costs to both highway and transitusers. These costs include operating costs, fuel costs, and congestion costs. Cambridge Systematics withEconomic Development Research Group, Public Transportation and the Nation’s Economy: A QuantitativeAnalysis of Public Transportation’s Economic Impact (New York: <strong>America</strong>n Public Transit Association,October, 1999).LJohn Landis, Subrajit Guhathakurta, William Huang, and Ming Zhang, “Rail Transit Investments, RealEstate Values, and Land Use Change: A Comparative Analysis of Five California Rail Transit Systems,”Monograph 48 (Berkeley: University of California, Institute of Urban and Regional Development, 1995).As cited in Robert Cervero, “Transit Villages in California: Progress, Prospects, and Policy Reforms,”Working Paper 98-08 (Berkeley: University of California, Institute of Urban and Regional Development,October 1998).<strong>MB</strong>ernick and Cervero 132.Valley Connections ■ Chapter II ■ Page 11
- Page 4 and 5: June 29, 2001 ■Model Transit-Orie
- Page 6 and 7: June 29, 2001 ■Model Transit-Orie
- Page 8 and 9: June 29, 2001 ■Model Transit-Orie
- Page 10 and 11: June 29, 2001 ■ Model Transit-Ori
- Page 12 and 13: June 29, 2001 ■ Model Transit-Ori
- Page 14 and 15: June 29, 2001 ■ Model Transit-Ori
- Page 16 and 17: June 29, 2001 ■ Model Transit-Ori
- Page 20 and 21: June 29, 2001 ν Model Transit-Orie
- Page 22 and 23: June 29, 2001 ■ Model Transit-Ori
- Page 24 and 25: June 29, 2001 ■Model Transit-Orie
- Page 26 and 27: June 29, 2001 ■Model Transit-Orie
- Page 28 and 29: June 29, 2001 ■Model Transit-Orie
- Page 30 and 31: June 29, 2001 ■Model Transit-Orie
- Page 32 and 33: June 29, 2001 ■Model Transit-Orie
- Page 34 and 35: June 29, 2001 ■Model Transit-Orie
- Page 36 and 37: June 29, 2001 ■Model Transit-Orie
- Page 38 and 39: June 29, 2001 ■Model Transit-Orie
- Page 40 and 41: June 29, 2001 ■Model Transit-Orie
- Page 42 and 43: June 29, 2001 ■Model Transit-Orie
- Page 44 and 45: June 29, 2001 ■Model Transit-Orie
- Page 46 and 47: June 29, 2001 ■Model Transit-Orie
- Page 48 and 49: June 29, 2001 ■Model Transit-Orie
- Page 50 and 51: June 29, 2001 ■Model Transit-Orie
- Page 52 and 53: June 29, 2001 ■Model Transit-Orie
- Page 54 and 55: June 29, 2001 ■Model Transit-Orie
- Page 57 and 58: Model Transit-Oriented District Ove
- Page 59 and 60: Model Transit-Oriented District Ove
- Page 61 and 62: Model Transit-Oriented District Ove
- Page 63 and 64: Model Transit-Oriented District Ove
- Page 65 and 66: Model Transit-Oriented District Ove
- Page 67 and 68: Model Transit-Oriented District Ove
- Page 69 and 70:
Model Transit-Oriented District Ove
- Page 71 and 72:
Model Transit-Oriented District Ove
- Page 73 and 74:
Model Transit-Oriented District Ove
- Page 75:
Model Transit-Oriented District Ove
- Page 78 and 79:
June 29, 2001 ■Model Transit-Orie
- Page 80 and 81:
June 29, 2001 ■Model Transit-Orie
- Page 82 and 83:
June 29, 2001 ■Model Transit-Orie
- Page 84 and 85:
June 29, 2001 ■Model Transit-Orie
- Page 86 and 87:
June 29, 2001 ■Model Transit-Orie
- Page 88 and 89:
June 29, 2001 ■Model Transit-Orie
- Page 90 and 91:
June 29, 2001 ■Model Transit-Orie
- Page 92 and 93:
June 29, 2001 ■Model Transit-Orie
- Page 94 and 95:
June 29, 2001 ■Model Transit-Orie
- Page 96 and 97:
June 29, 2001 ■Model Transit-Orie
- Page 98 and 99:
June 29, 2001 ■Model Transit-Orie
- Page 100 and 101:
June 29, 2001 ■Model Transit-Orie
- Page 102 and 103:
June 29, 2001 ■Model Transit-Orie
- Page 105 and 106:
Model Transit-Oriented District Ove
- Page 107 and 108:
Model Transit-Oriented District Ove
- Page 109 and 110:
Model Transit-Oriented District Ove
- Page 111 and 112:
Model Transit-Oriented District Ove
- Page 113 and 114:
Model Transit-Oriented District Ove
- Page 115 and 116:
Model Transit-Oriented District Ove
- Page 117 and 118:
Model Transit-Oriented District Ove
- Page 119 and 120:
Model Transit-Oriented District Ove
- Page 121 and 122:
Model Transit-Oriented District Ove
- Page 123 and 124:
Model Transit-Oriented District Ove
- Page 125 and 126:
Model Transit-Oriented District Ove
- Page 127 and 128:
Model Transit-Oriented District Ove
- Page 129 and 130:
Model Transit-Oriented District Ove
- Page 131 and 132:
Model Transit-Oriented District Ove
- Page 133 and 134:
Model Transit-Oriented District Ove
- Page 135 and 136:
Model Transit-Oriented District Ove
- Page 137 and 138:
Model Transit-Oriented District Ove
- Page 139 and 140:
Model Transit-Oriented District Ove
- Page 141 and 142:
Model Transit-Oriented District Ove
- Page 143 and 144:
Model Transit-Oriented District Ove
- Page 145 and 146:
Model Transit-Oriented District Ove
- Page 147 and 148:
Model Transit-Oriented District Ove
- Page 149 and 150:
Model Transit-Oriented District Ove
- Page 151:
Model Transit-Oriented District Ove