Model TOD Zoning Ordinance (PDF, 3.7 MB) - Reconnecting America
Model TOD Zoning Ordinance (PDF, 3.7 MB) - Reconnecting America
Model TOD Zoning Ordinance (PDF, 3.7 MB) - Reconnecting America

You also want an ePaper? Increase the reach of your titles
YUMPU automatically turns print PDFs into web optimized ePapers that Google loves.
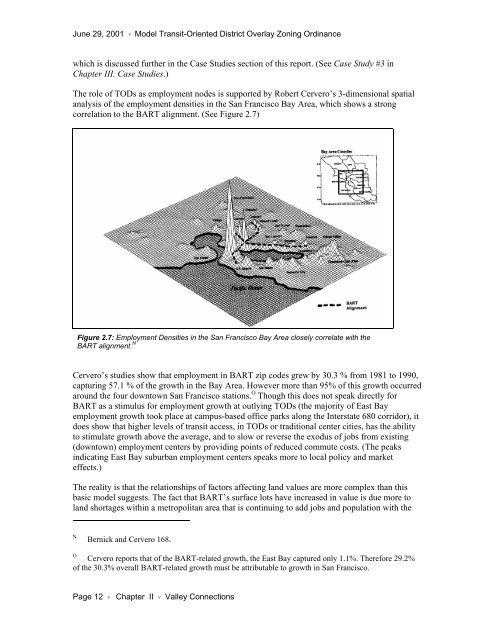
June 29, 2001 ν <strong>Model</strong> Transit-Oriented District Overlay <strong>Zoning</strong> <strong>Ordinance</strong>which is discussed further in the Case Studies section of this report. (See Case Study #3 inChapter III. Case Studies.)The role of <strong>TOD</strong>s as employment nodes is supported by Robert Cervero’s 3-dimensional spatialanalysis of the employment densities in the San Francisco Bay Area, which shows a strongcorrelation to the BART alignment. (See Figure 2.7)Figure 2.7: Employment Densities in the San Francisco Bay Area closely correlate with theBART alignment. NCervero’s studies show that employment in BART zip codes grew by 30.3 % from 1981 to 1990,capturing 57.1 % of the growth in the Bay Area. However more than 95% of this growth occurredaround the four downtown San Francisco stations. O Though this does not speak directly forBART as a stimulus for employment growth at outlying <strong>TOD</strong>s (the majority of East Bayemployment growth took place at campus-based office parks along the Interstate 680 corridor), itdoes show that higher levels of transit access, in <strong>TOD</strong>s or traditional center cities, has the abilityto stimulate growth above the average, and to slow or reverse the exodus of jobs from existing(downtown) employment centers by providing points of reduced commute costs. (The peaksindicating East Bay suburban employment centers speaks more to local policy and marketeffects.)The reality is that the relationships of factors affecting land values are more complex than thisbasic model suggests. The fact that BART’s surface lots have increased in value is due more toland shortages within a metropolitan area that is continuing to add jobs and population with theNBernick and Cervero 168.OCervero reports that of the BART-related growth, the East Bay captured only 1.1%. Therefore 29.2%of the 30.3% overall BART-related growth must be attributable to growth in San Francisco.Page 12 νChapter II ν Valley Connections