National Archives of Australia - Annual reports
National Archives of Australia - Annual reports
National Archives of Australia - Annual reports

Create successful ePaper yourself
Turn your PDF publications into a flip-book with our unique Google optimized e-Paper software.
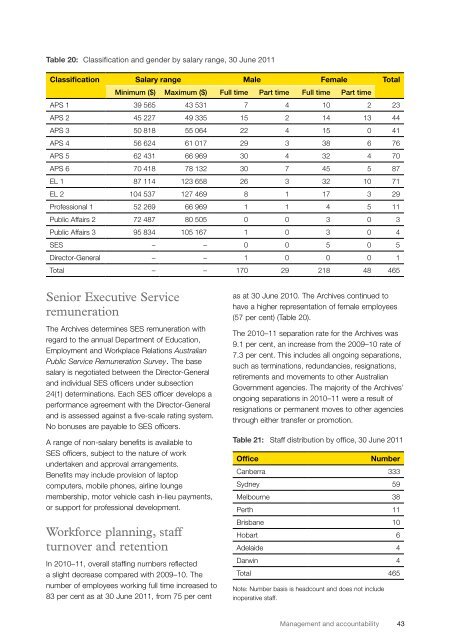
Table 20: Classification and gender by salary range, 30 June 2011Classification Salary range Male Female TotalMinimum ($) Maximum ($) Full time Part time Full time Part timeAPS 1 39 565 43 531 7 4 10 2 23APS 2 45 227 49 335 15 2 14 13 44APS 3 50 818 55 064 22 4 15 0 41APS 4 56 624 61 017 29 3 38 6 76APS 5 62 431 66 969 30 4 32 4 70APS 6 70 418 78 132 30 7 45 5 87EL 1 87 114 123 658 26 3 32 10 71EL 2 104 537 127 469 8 1 17 3 29Pr<strong>of</strong>essional 1 52 269 66 969 1 1 4 5 11Public Affairs 2 72 487 80 505 0 0 3 0 3Public Affairs 3 95 834 105 167 1 0 3 0 4SES – – 0 0 5 0 5Director-General – – 1 0 0 0 1Total – – 170 29 218 48 465Senior Executive ServiceremunerationThe <strong>Archives</strong> determines SES remuneration withregard to the annual Department <strong>of</strong> Education,Employment and Workplace Relations <strong>Australia</strong>nPublic Service Remuneration Survey. The basesalary is negotiated between the Director-Generaland individual SES <strong>of</strong>ficers under subsection24(1) determinations. Each SES <strong>of</strong>ficer develops aperformance agreement with the Director-Generaland is assessed against a five-scale rating system.No bonuses are payable to SES <strong>of</strong>ficers.A range <strong>of</strong> non-salary benefits is available toSES <strong>of</strong>ficers, subject to the nature <strong>of</strong> workundertaken and approval arrangements.Benefits may include provision <strong>of</strong> laptopcomputers, mobile phones, airline loungemembership, motor vehicle cash in-lieu payments,or support for pr<strong>of</strong>essional development.Workforce planning, staffturnover and retentionIn 2010–11, overall staffing numbers reflecteda slight decrease compared with 2009–10. Thenumber <strong>of</strong> employees working full time increased to83 per cent as at 30 June 2011, from 75 per centas at 30 June 2010. The <strong>Archives</strong> continued tohave a higher representation <strong>of</strong> female employees(57 per cent) (Table 20).The 2010–11 separation rate for the <strong>Archives</strong> was9.1 per cent, an increase from the 2009–10 rate <strong>of</strong>7.3 per cent. This includes all ongoing separations,such as terminations, redundancies, resignations,retirements and movements to other <strong>Australia</strong>nGovernment agencies. The majority <strong>of</strong> the <strong>Archives</strong>’ongoing separations in 2010–11 were a result <strong>of</strong>resignations or permanent moves to other agenciesthrough either transfer or promotion.Table 21: Staff distribution by <strong>of</strong>fice, 30 June 2011OfficeNumberCanberra 333Sydney 59Melbourne 38Perth 11Brisbane 10Hobart 6Adelaide 4Darwin 4Total 465Note: Number basis is headcount and does not includeinoperative staff.Management and accountability 43