<strong>Situation</strong> <strong>analySiS</strong> of Children in uganda 2015Even though FGM/C rates are relatively low in most areas of the country, they are relatedto complicated labour and delivery, often leading to maternal mortality. In Sabiny, whereFGM/C rates are up to 13.5% (Namulondo, 2009), each family is said to have at least onecasualty of FGM due to the fact that there is generally extensive scarring caused by Sabinyexcision. A country profile of FGM in Uganda (28 Too Many, 2013) finds that there is also riskto the baby if the mother has been circumcised. For example, girls and women with Type IIIcutting 5 are 66% more likely to have babies that need to be resuscitated.Statistics show that highly educated women (to secondary level and above) are morelikely to be assisted by a skilled birth attendant than uneducated women (81% and 38%respectively) (UBOS and ICF International, 2012). The UDHS speculates that respondentsin urban areas are often more educated and wealthier than their rural counterparts, sothe perceived relationship between education and health may be more to do with urbanlocation, socioeconomic status and greater access to services. These correlations couldexplain the fact that women in the highest wealth quintile are also much more likely to beassisted by a skilled attendant (88%) than women in the lowest wealth quintile (44%; UBOSand ICF International, 2012). Major disparities in delivery at health facilities by women arenoted across regions, Karamoja having the lowest rate (27.1%), followed by South-West(40.3%), Eastern (51.2%), North (51.9%), Western (55.9%), West Nile (58.7%), Central 1(61.7%), Central 2 (69%) and Kampala (92.9%). In South-West region, 19% of women givebirth with no one in attendance (see Appendix 2).Ante- and postnatal careUptake of many lifesaving health services – such as antenatal care – remains low. Although95% of pregnant women attend their first antenatal visit, only 48% complete the WorldHealth Organization (WHO) recommended minimum of four antenatal visits, and most ofthese women live in urban areas (UBOS and ICF International, 2012). This is far below thenational target of 75% by the end of 2015 (MoH, 2013b). Further, only one in two womenwho attend an antenatal clinic is warned about pregnancy complications.Nationally, 71% of facilities offer antenatal care. However, certain regions have significantlygreater service provision than others: Central, West Nile and Kampala regions have a highpercentage of facilities offering antenatal care. In the North-Eastern, Western and South-Western regions the number of antenatal care facilities is much lower (MoH and MacroInternational, 2008). Women in the Central and Kampala regions are more likely to receiveantenatal care from a doctor, whereas women in the Eastern, Karamoja and West Nileregions are least likely.Despite the importance of high-quality antenatal care (ANC) services, items that supporthigh-quality ANC counselling (visual aids, ANC guidelines and individual client cards) arenot available in most facilities offering ANC services (MoH and Macro International, 2008).5. Narrowing of the vaginal orifice with creation of a covering seal by cutting and appositioning the labia minora and/or the labia majora, withor without excision of the clitoris (infibulation).32 thE rIGht to SUrvIvaL
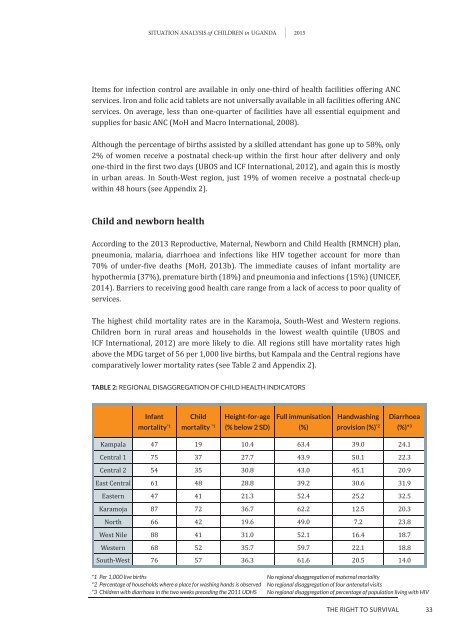
<strong>Situation</strong> <strong>analySiS</strong> of Children in uganda 2015Items for infection control are available in only one-third of health facilities offering ANCservices. Iron and folic acid tablets are not universally available in all facilities offering ANCservices. On average, less than one-quarter of facilities have all essential equipment andsupplies for basic ANC (MoH and Macro International, 2008).Although the percentage of births assisted by a skilled attendant has gone up to 58%, only2% of women receive a postnatal check-up within the first hour after delivery and onlyone-third in the first two days (UBoS and ICF International, 2012), and again this is mostlyin urban areas. In South-West region, just 19% of women receive a postnatal check-upwithin 48 hours (see Appendix 2).Child and newborn healthAccording to the 2013 Reproductive, Maternal, Newborn and Child Health (RMNCH) plan,pneumonia, malaria, diarrhoea and infections like HIV together account for more than70% of under-five deaths (MoH, 2013b). The immediate causes of infant mortality arehypothermia (37%), premature birth (18%) and pneumonia and infections (15%) (UNICEF,2014). Barriers to receiving good health care range from a lack of access to poor quality ofservices.The highest child mortality rates are in the Karamoja, South-West and Western regions.Children born in rural areas and households in the lowest wealth quintile (UBOS andICF International, 2012) are more likely to die. All regions still have mortality rates highabove the MDG target of 56 per 1,000 live births, but Kampala and the Central regions havecomparatively lower mortality rates (see Table 2 and Appendix 2).TABLE 2: reGionAl disAGGreGAtion of child heAlth indicAtorsInfantmortality *1Childmortality *1Height-for-age(% below 2 SD)Full immunisation(%)Handwashingprovision (%) *2Diarrhoea(%)* 3Kampala 47 19 10.4 63.4 39.0 24.1Central 1 75 37 27.7 43.9 50.1 22.3Central 2 54 35 30.8 43.0 45.1 20.9East Central 61 48 28.8 39.2 30.6 31.9Eastern 47 41 21.3 52.4 25.2 32.5Karamoja 87 72 36.7 62.2 12.5 20.3North 66 42 19.6 49.0 7.2 23.8West Nile 88 41 31.0 52.1 16.4 18.7Western 68 52 35.7 59.7 22.1 18.8South-West 76 57 36.3 61.6 20.5 14.0*1 Per 1,000 live births*2 Percentage of households where a place for washing hands is observed*3 Children with diarrhoea in the two weeks preceding the 2011 UDHSNo regional disaggregation of maternal mortalityNo regional disaggregation of four antenatal visitsNo regional disaggregation of percentage of population living with HIVthE rIGht to SUrvIvaL33