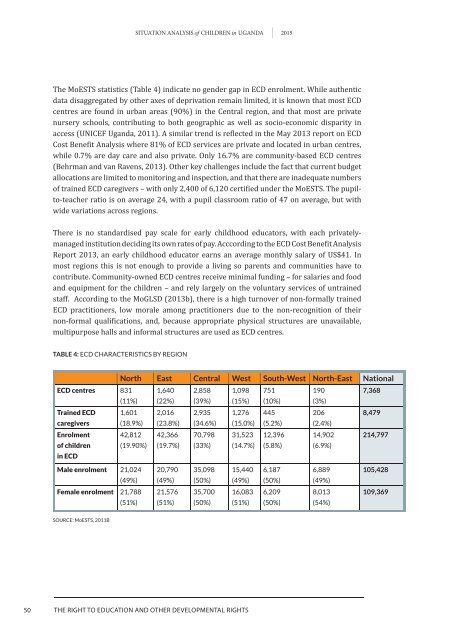
<strong>Situation</strong> <strong>analySiS</strong> of Children in uganda 2015The MoESTS statistics (Table 4) indicate no gender gap in ECD enrolment. While authenticdata disaggregated by other axes of deprivation remain limited, it is known that most ECDcentres are found in urban areas (90%) in the Central region, and that most are privatenursery schools, contributing to both geographic as well as socio-economic disparity inaccess (UNICEF Uganda, 2011). A similar trend is reflected in the May 2013 report on ECDCost Benefit Analysis where 81% of ECD services are private and located in urban centres,while 0.7% are day care and also private. Only 16.7% are community-based ECD centres(Behrman and van Ravens, 2013). Other key challenges include the fact that current budgetallocations are limited to monitoring and inspection, and that there are inadequate numbersof trained ECD caregivers – with only 2,400 of 6,120 certified under the MoESTS. The pupilto-teacherratio is on average 24, with a pupil classroom ratio of 47 on average, but withwide variations across regions.There is no standardised pay scale for early childhood educators, with each privatelymanagedinstitution deciding its own rates of pay. Acccording to the ECD Cost Benefit AnalysisReport 2013, an early childhood educator earns an average monthly salary of US$41. Inmost regions this is not enough to provide a living so parents and communities have tocontribute. Community-owned ECD centres receive minimal funding – for salaries and foodand equipment for the children – and rely largely on the voluntary services of untrainedstaff. According to the MoGLSD (2013b), there is a high turnover of non-formally trainedECD practitioners, low morale among practitioners due to the non-recognition of theirnon-formal qualifications, and, because appropriate physical structures are unavailable,multipurpose halls and informal structures are used as ECD centres.TABLE 4: ecd chArActeristics by reGionNorth East Central West South-West North-East Nationalecd centres 831 1,640 2,858 1,098 7511907,368(11%) (22%) (39%) (15%) (10%)(3%)trained ecd 1,601 2,016 2,935 1,276 4452068,479caregivers(18.9%) (23.8%) (34.6%) (15.0%) (5.2%)(2.4%)enrolmentof childrenin ecd42,812(19.90%)42,366(19.7%)70,798(33%)31,523(14.7%)12,396(5.8%)14,902(6.9%)214,797male enrolment 21,024(49%)20,790(49%)35,098(50%)15,440(49%)6,187(50%)6,889(49%)105,428female enrolment 21,788(51%)21,576(51%)35,700(50%)16,083(51%)6,209(50%)8,013(54%)109,369source: moests, 2011b50 thE rIGht to EDUCatIoN aND othEr DEvELoPMENtaL rIGhtS
<strong>Situation</strong> <strong>analySiS</strong> of Children in uganda 20154.2.2 The case for integrated ECDProgramming and policy approaches have a tendency to equate ECD with early childhoodeducation whereas it should involve, at a minimum, interventions in health, nutrition,education, and social and child protection, and should target pregnant women, youngchildren from birth, and parents and caregivers. Combined interventions provide spacefor multiple investments to address the same population targets, taking advantage of thesame facilities and infrastructure and connections in client contacts as well as other formsof bureaucracy (DiGirolamo, 2014). This integrated approach is key to promoting optimaldevelopmental and healthy physical growth for younger children.4.2.3 Response mechanism: early childhood developmentOne of the ways to eradicate poverty and reduce inequality is through the use of ECDprogrammes that put children on an equal footing prior to starting primary school,regardless of the varied circumstances of their lives (Kisitu, 2009). This notion is expressedin a number of international declarations and frameworks like the MDGs, Health for All,Education for All and the New Partnership for African Development (NEPAD), all of whichrefer to ECD as a priority area.Although there is a tendency to equate ECD with early childhood education (pre-primary), itis in reality a complex area, focusing on a cohort from 0–8 years of age, purposely to help thechild grow and thrive physically, mentally, emotionally, spiritually, morally and socially. Itincludes a wide range of services to provide basic health care, adequate nutrition, water andsanitation, nurturing and stimulation within a caring safe and clean environment for childrenand their families and other child care aspects. Investing technical and infrastructuralresources in ECD can have significant effects on a child’s developmental trajectory both inthe immediate and longer term. In 2011, 62% of children aged three to five years in Kampalawere attending pre-primary school, while in Karamoja and West Nile the figure was just 6%and 5% respectively (UBOS and ICF International, 2012 – see Appendix 2). Since morethan 80% of ECD services are private, access unevenly favours those who can afford them.A child living in a household in the highest wealth quintile is 7.5% more likely to attendpre-primary school than a child in the lowest wealth quintile (UBOS and ICF International,2012 – see Appendix 2).To address the challenges and gaps in providing optimal early childhood development toUgandan children, in 2007, the Government included ECD in its legislation. Accordingly,through the Uganda Nutrition Action Plan, OVC Strategy and Immunisation Policy, amongothers, there is an emphasis on the importance of early childhood development in thecountry. This situation analysis therefore focuses on early childhood development acrossall sectors.thE rIGht to EDUCatIoN aND othEr DEvELoPMENtaL rIGhtS51