Lead Manager
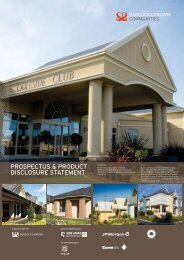
babcock & brown limited prospectus.pdf - Astrojapanproperty.com
babcock & brown limited prospectus.pdf - Astrojapanproperty.com
- No tags were found...
Create successful ePaper yourself
Turn your PDF publications into a flip-book with our unique Google optimized e-Paper software.
SECTION 3<br />
BUSINESS OVERVIEW<br />
Babcock & Brown seeks to have a strong local presence in each of the countries in which it operates, and to staff<br />
its offices predominantly with citizens or nationals of that country. Local knowledge and relationship networks<br />
have enhanced Babcock & Brown’s ability to grow its business in new jurisdictions and have made a strong<br />
contribution to the Group’s transaction origination capabilities.<br />
Babcock & Brown promotes a collegial and informal culture with a strong work ethic and is characterised by<br />
relative lack of hierarchy, a relatively flat management structure and team orientation. Babcock & Brown believes<br />
that these factors have all contributed to a relatively low turnover amongst professional staff, particularly at the<br />
senior levels.<br />
Employee investment<br />
Executives are also prominent investors in a number of Babcock & Brown investment products.This is expected<br />
to continue post-listing, so that Executives will be able to participate in syndications alongside (and on the same<br />
terms) as third party investors.The Directors believe that this should provide strong alignment between the<br />
interests of Executives, Shareholders and investors going forward.A summary of the policy is set out in Section<br />
4.8.1.<br />
Financial summary<br />
The table below summarises the historical and Forecast Net Revenue by Business Group and should be read in<br />
conjunction with, and qualified by, the more detailed financial information in Section 5.<br />
Year to 31 December ($000) 2001A 2002A 2003A 2004F 2005F<br />
Net Revenue<br />
– Real Estate 30,779 25,716 64,198 83,527 117,797<br />
– Infrastructure and Project Finance 42,744 69,456 84,352 104,111 156,717<br />
– Operating Leasing 82,036 83,226 79,704 101,619 122,604<br />
– Structured Finance 171,784 156,998 124,573 96,524 97,127<br />
– Corporate Principal Investment<br />
and Funds Management (996) 12,439 38,655 38,328 29,120<br />
Net Revenue 326,347 347,835 391,482 424,109 523,365<br />
Other revenue (1,263) 600 1,073<br />
Total business revenue 325,083 348,435 392,555 424,109 523,365<br />
Net Revenue by earnings type 2<br />
– Advisory 172,106 174,273 169,561<br />
– Investment Management 118,561 143,339 185,946<br />
– Principal Investment 100,815 106,497 167,858<br />
Total Net Revenue 326,347 347,835 391,482 424,109 523,365<br />
NOTES<br />
1.All amounts in foreign currencies for historical financial information in 2001-2003 and forecast financial information for 2004 and 2005 are translated at<br />
constant exchange rates based on the rates assumed for the 2004 Forecasts. Prior to the Offer, the Group managed its activities with US dollars as its benchmark<br />
currency. Historical financial information has been prepared from statements prepared in US dollars.This use of constant exchange rates, whilst not consistent<br />
with Australian GAAP, has been adopted in the table above and in the Business Overviews in Section 3 of this Prospectus, as Babcock & Brown believes that<br />
this basis provides a more meaningful insight into the activities and financial performance of Babcock & Brown given the prior practice of managing its<br />
activities using the US dollar as its benchmark currency.<br />
2. Net Revenue by earnings type was not collated prior to 2003.<br />
40


