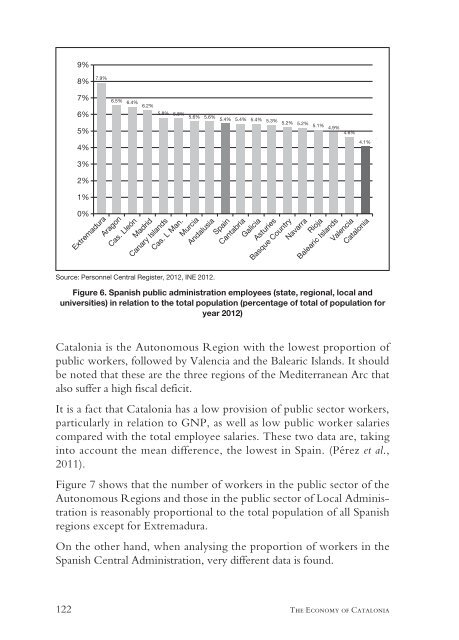
9% 8% 7.9% 7% 6.5% 6.4% 6.2% 5.8% 5.8% 5.6% 5.6% 5.4% 5.4% 5.4% 5.3% 5.2% 5.2% 5.1% 4.9% 4.6% 6% 5% 4% 3% 2% 1% 0% Extremadura Source: Personnel Central Register, 2012, INE 2012. Aragon Cas. Lleón Madrid Canary Islands Cas. L Man. Murcia Andalusia Spain Cantabria Galicia Asturies Basque Country 4.1% Navarra Rioja Balearic Islands Valencia <strong>Catalonia</strong> Figure 6. Spanish public administration employees (state, regional, local and universities) in relation to the total population (percentage <strong>of</strong> total <strong>of</strong> population for year 2012) <strong>Catalonia</strong> is the Autonomous Region with the lowest proportion <strong>of</strong> public workers, followed by Valencia and the Balearic Islands. It should be noted that these are the three regions <strong>of</strong> the Mediterranean Arc that also suffer a high fiscal deficit. It is a fact that <strong>Catalonia</strong> has a low provision <strong>of</strong> public sector workers, particularly in relation to GNP, as well as low public worker salaries compared with the total employee salaries. <strong>The</strong>se two data are, taking into account the mean difference, the lowest in Spain. (Pérez et al., 2011). Figure 7 shows that the number <strong>of</strong> workers in the public sector <strong>of</strong> the Autonomous Regions and those in the public sector <strong>of</strong> Local Administration is reasonably proportional to the total population <strong>of</strong> all Spanish regions except for Extremadura. On the other hand, when analysing the proportion <strong>of</strong> workers in the Spanish Central Administration, very different data is found. 122 <strong>The</strong> <strong>Economy</strong> <strong>of</strong> <strong>Catalonia</strong>
Population Total public sector State public sector Autonomous Reg. public sector Local adm. public sector University public sector Workers. % pop Workers. % pop Workers. % pop Workers. % pop Workers. % pop Spain 47,265,321 2,567,121 5.43 % 561,066 1.19 % 1,307,343 2.77 % 549,807 1.16 % 148,905 0.32 % Andalusia 8,449,985 470,426 5.57 % 92,577 1.10 % 238,909 2.83 % 113,369 1.34 % 25,571 0.30 % <strong>Catalonia</strong> 7,570,908 306,976 4.05 % 30,136 0.40 % 165,092 2.18 % 86,657 1.14 % 25,091 0.33 % Madrid 6,498,560 405,998 6.25 % 167,197 2.57 % 154,530 2.38 % 55,511 0.85 % 28,760 0.44 % Valencia 5,129,266 237,379 4.63 % 38,489 0.75 % 127,824 2.49 % 53,221 1.04 % 17,845 0.35 % Galicia 2,781,498 150,551 5.41 % 29,092 1.05 % 87,026 3.13 % 26,725 0.96 % 7,708 0.28 % Castilla y León 2,546,078 164,221 6.45 % 39,602 1.56 % 85,671 3.36 % 30,565 1.20 % 8,383 0.33 % Basque country 2,193,093 114,325 5.21 % 13,072 0.60 % 67,488 3.08 % 27,469 1.25 % 6,296 0.29 % Cast. la Mancha 2,121,888 122,073 5.75 % 19,236 0.91 % 66,790 3.15 % 32,884 1.55 % 3,163 0.15 % Canary Islands 2,118,344 122,665 5.79 % 25,543 1.21 % 59,948 2.83 % 32,549 1.54 % 4,625 0.22 % Murcia 1,474,449 82,153 5.57 % 17,582 1.19 % 47,028 3.19 % 12,692 0.86 % 4,851 0.33 % Aragon 1,349,467 88,320 6.54 % 23,165 1.72 % 42,319 3.14 % 17,763 1.32 % 5,073 0.38 % Balearic Islands 1,119,439 55,135 4.93 % 11,208 1.00 % 27,947 2.50 % 14,233 1.27 % 1,747 0.16 % Extremadura 1,108,130 87,713 7.92 % 13,810 1.25 % 46,484 4.19 % 24,576 2.22 % 2,843 0.26 % Asturias 1,077,360 57,569 5.34 % 10,692 0.99 % 34,744 3.22 % 9,310 0.86 % 2,823 0.26 % Navarra 644,566 33,368 5.18 % 4,542 0.70 % 23,095 3.58 % 4,372 0.68 % 1,359 0.21 % Cantabria 593,861 32,230 5.43 % 5,361 0.90 % 19,555 3.29 % 5,495 0.93 % 1,819 0.31 % La Rioja 323,609 16,346 5.05 % 3,355 1.04 % 9,884 3.05 % 2,416 0.75 % 691 0.21 % Ceuta 84,018 9,808 11.67 % 8,185 9.74 % 1,504 1.79 % 0 119 0.14 % Melilla 80,802 9,865 12.21 % 8,222 10.18 % 1,505 1.86 % 0 138 0.17 % Source: Central Personnel Record <strong>of</strong> Ministry <strong>of</strong> Finance and Public Administration (01/01/2013). INE (National Institute <strong>of</strong> Statistics) 2012. Figure 7. Spanish public administration workers (state, autonomous regions, local and universities) (01/01/2013) Structures <strong>of</strong> state and their impact on labour 123
- Page 1:
The Economy of Catalonia Questions
- Page 5 and 6:
Oriol Amat, Núria Bosch, Antoni Ca
- Page 7 and 8:
Contents Preface to the English Edi
- Page 9 and 10:
Preface to the English edition This
- Page 11 and 12:
Preface (Translated by Jordi Vilano
- Page 13 and 14:
Introduction (Translated by Jordi V
- Page 15 and 16:
1 The position of an independent Ca
- Page 17 and 18:
United States such as Massachusetts
- Page 19 and 20:
2010, Catalonia was in 64th place o
- Page 21 and 22:
fact, this combination of factors a
- Page 23 and 24:
ilar population to Catalonia and sh
- Page 25 and 26:
ence in emerging markets, especiall
- Page 27 and 28:
fact, the high proportion of multin
- Page 29 and 30:
egion in volume of inward investmen
- Page 31:
mega-regions towards sustainability
- Page 34 and 35:
also be confronted with the paradox
- Page 36 and 37:
the reasons that are emerging for a
- Page 38 and 39:
This 47.1% signifies a considerable
- Page 40 and 41:
2005 2006 2007 2008 2009 2010 Estim
- Page 42 and 43:
and there would be no need for cuts
- Page 44 and 45:
centage of freight between Spain an
- Page 46 and 47:
to prevent Spain’s point-blank re
- Page 48 and 49:
) The effects on markets, especiall
- Page 50 and 51:
speak of the coefficient of central
- Page 52 and 53:
Bibliographical references Amat, O.
- Page 54 and 55:
Rodríguez Mora, J. V. (2012) «Por
- Page 56 and 57:
For the purposes of economic analys
- Page 58 and 59:
It should also be recalled that the
- Page 60 and 61:
The reasons for regional economic i
- Page 62 and 63:
their mind» about European integra
- Page 64 and 65:
the Copenhagen criteria, which esta
- Page 66 and 67:
in the European Economic Area, whic
- Page 68 and 69:
ing the status of member of the Uni
- Page 71 and 72:
3.2. In or out of the European Unio
- Page 73 and 74: were to veto the request, experts e
- Page 75 and 76: In November 2012, Granell expressed
- Page 77 and 78: -The regulatory fragmentation that
- Page 79 and 80: would have to find alternative solu
- Page 81 and 82: economic shocks, any one of which,
- Page 83 and 84: In my opinion, an impartial reading
- Page 85 and 86: 4 In or out of the euro 4.1. An ind
- Page 87 and 88: Analysis of possible scenarios Scen
- Page 89 and 90: official currency and financial ins
- Page 91 and 92: nisms and the European interbank pa
- Page 93 and 94: arising from the integration of a h
- Page 95 and 96: 4.2. In or out ofthe euro: certaint
- Page 97 and 98: prevent or limit damage to the mult
- Page 99 and 100: Let me make a short comment on the
- Page 101 and 102: context of a Spain that leaves the
- Page 103: Col·lectiu Wilson (2012) «Europe,
- Page 106 and 107: termediation, which is performed by
- Page 108 and 109: The Catalan financial system The Ca
- Page 110 and 111: Financial institutions with headqua
- Page 112 and 113: • The bank was put up for auction
- Page 114 and 115: had risen by 16.3%, staff had been
- Page 116 and 117: go to Brussels and say that they ha
- Page 118 and 119: Appendix This article is complement
- Page 120 and 121: The Catalan Public Sector in the Eu
- Page 122 and 123: 20% 18% 18.8% 16% 16.2% 15.5% 13.6%
- Page 126 and 127: It is very obvious that Madrid has
- Page 128 and 129: Spain Catalonia Generalitat Variati
- Page 130 and 131: - Armed Forces: in the form of army
- Page 132 and 133: Pérez, F. (DIR), Cucarella, V. and
- Page 134 and 135: and to the private sector. Another
- Page 136 and 137: 2006 2007 2008 2009 Direct taxes 17
- Page 138 and 139: method, that is to say, the expense
- Page 140 and 141: itory. The same applies to the prog
- Page 142 and 143: 2006 2007 2008 2009 Spanish State e
- Page 144 and 145: e obtained. Table 3 shows that the
- Page 146 and 147: with the EU in the period 2007-2013
- Page 149 and 150: 8 Debt and distribution of assets 2
- Page 151 and 152: this study. The difference between
- Page 153 and 154: the State’s property and debts on
- Page 155 and 156: It may be asked whether the new Cat
- Page 157 and 158: The main source of International La
- Page 159 and 160: Principles of distribution of asset
- Page 161 and 162: Immovable property of the State con
- Page 163 and 164: Social Security Reserve Fund On con
- Page 165 and 166: Investments according to Additional
- Page 167 and 168: Forecasts Million euros 2007 2008 2
- Page 169 and 170: Possible negotiation scenarios What
- Page 171 and 172: Even if it were only possible to ev
- Page 173 and 174: States that form part of 21st-centu
- Page 175:
Spanish Royal Decree 496/1987, of 1
- Page 178 and 179:
Social Security contributions, pens
- Page 180 and 181:
ury and its managing agencies (auto
- Page 182 and 183:
citizens tend to join the labour ma
- Page 184 and 185:
in the economic, social and cultura
- Page 186 and 187:
declaration of independence, the bo
- Page 188 and 189:
oycott would have a more pronounced
- Page 190 and 191:
the will of the people. The great m
- Page 192 and 193:
Guinjoan, M. and Cuadras, X. (2011)
- Page 194 and 195:
Denmark, Finland, Austria, the Neth
- Page 196 and 197:
2012 Company Sector Sales (€m) 1
- Page 198 and 199:
Export companies There were 43,176
- Page 200 and 201:
Spain, and appreciably more than th
- Page 202 and 203:
Conclusions After considering how c
- Page 204 and 205:
likely to be in the firing line are
- Page 206 and 207:
IDESCAT (2013), based on data from
- Page 208 and 209:
the sample represents 20.8% of its
- Page 210 and 211:
No opinion Increase the centralisat
- Page 212 and 213:
sioners, business people and/or the
- Page 214 and 215:
Impact on the Catalan economy In th
- Page 216 and 217:
alternative. This is not supported
- Page 218 and 219:
More specifically, 94.6% of pension
- Page 220 and 221:
37.8% 57.8% 4.4% Yes No opinion No
- Page 222 and 223:
fessionally and 47.8% believe it wo
- Page 225 and 226:
13 Conclusions: economic certaintie
- Page 227 and 228:
having less potential and less per
- Page 229 and 230:
Catalonia had been an independent S
- Page 231:
ands and a declining proportion of
- Page 234:
Anton Gasol. Doctor of Economics, f