

The Economy of Catalonia
the_economy_of_catalonia._questions_and_answers_on_the_economic_impact_of_independence
the_economy_of_catalonia._questions_and_answers_on_the_economic_impact_of_independence

Create successful ePaper yourself
Turn your PDF publications into a flip-book with our unique Google optimized e-Paper software.
ury and its managing agencies (autonomous bodies that manage social<br />
benefits, such as the one in charge <strong>of</strong> unemployment benefits), and mutual<br />
companies such as that <strong>of</strong> Spanish civil servants, MUFACE (Mutualidad<br />
General de Funcionarios Civiles del Estado – <strong>The</strong> Mutual Health<br />
Insurance Company for Spanish Civil Servants).<br />
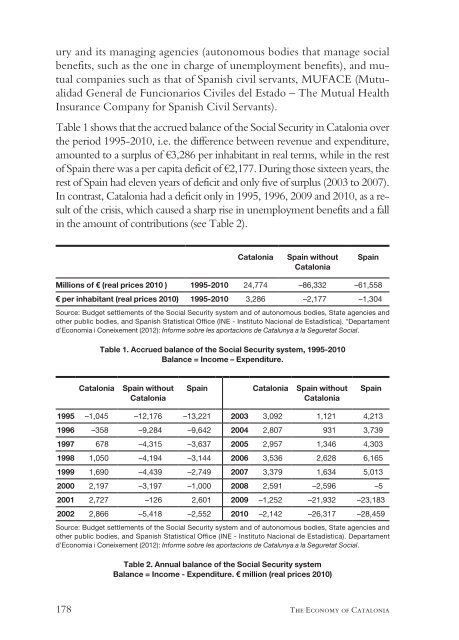
Table 1 shows that the accrued balance <strong>of</strong> the Social Security in <strong>Catalonia</strong> over<br />
the period 1995-2010, i.e. the difference between revenue and expenditure,<br />
amounted to a surplus <strong>of</strong> €3,286 per inhabitant in real terms, while in the rest<br />
<strong>of</strong> Spain there was a per capita deficit <strong>of</strong> €2,177. During those sixteen years, the<br />
rest <strong>of</strong> Spain had eleven years <strong>of</strong> deficit and only five <strong>of</strong> surplus (2003 to 2007).<br />
In contrast, <strong>Catalonia</strong> had a deficit only in 1995, 1996, 2009 and 2010, as a result<br />
<strong>of</strong> the crisis, which caused a sharp rise in unemployment benefits and a fall<br />
in the amount <strong>of</strong> contributions (see Table 2).<br />
<strong>Catalonia</strong><br />
Spain without<br />
<strong>Catalonia</strong><br />
Spain<br />
Millions <strong>of</strong> € (real prices 2010 ) 1995-2010 24,774 –86,332 –61,558<br />
€ per inhabitant (real prices 2010) 1995-2010 3,286 –2,177 –1,304<br />
Source: Budget settlements <strong>of</strong> the Social Security system and <strong>of</strong> autonomous bodies, State agencies and<br />
other public bodies, and Spanish Statistical Office (INE - Instituto Nacional de Estadística). *Departament<br />
d’Economia i Coneixement (2012): Informe sobre les aportacions de Catalunya a la Seguretat Social.<br />
Table 1. Accrued balance <strong>of</strong> the Social Security system, 1995-2010<br />
Balance = Income – Expenditure.<br />
<strong>Catalonia</strong><br />
Spain without<br />
<strong>Catalonia</strong><br />
Spain <strong>Catalonia</strong> Spain without<br />
<strong>Catalonia</strong><br />
Spain<br />
1995 –1,045 –12,176 –13,221 2003 3,092 1,121 4,213<br />
1996 –358 –9,284 –9,642 2004 2,807 931 3,739<br />
1997 678 –4,315 –3,637 2005 2,957 1,346 4,303<br />
1998 1,050 –4,194 –3,144 2006 3,536 2,628 6,165<br />
1999 1,690 –4,439 –2,749 2007 3,379 1,634 5,013<br />
2000 2,197 –3,197 –1,000 2008 2,591 –2,596 –5<br />
2001 2,727 –126 2,601 2009 –1,252 –21,932 –23,183<br />
2002 2,866 –5,418 –2,552 2010 –2,142 –26,317 –28,459<br />
Source: Budget settlements <strong>of</strong> the Social Security system and <strong>of</strong> autonomous bodies, State agencies and<br />
other public bodies, and Spanish Statistical Office (INE - Instituto Nacional de Estadística). Departament<br />
d’Economia i Coneixement (2012): Informe sobre les aportacions de Catalunya a la Seguretat Social.<br />
Table 2. Annual balance <strong>of</strong> the Social Security system<br />
Balance = Income - Expenditure. € million (real prices 2010)<br />
178 <strong>The</strong> <strong>Economy</strong> <strong>of</strong> <strong>Catalonia</strong>