

The Economy of Catalonia
the_economy_of_catalonia._questions_and_answers_on_the_economic_impact_of_independence
the_economy_of_catalonia._questions_and_answers_on_the_economic_impact_of_independence

Create successful ePaper yourself
Turn your PDF publications into a flip-book with our unique Google optimized e-Paper software.
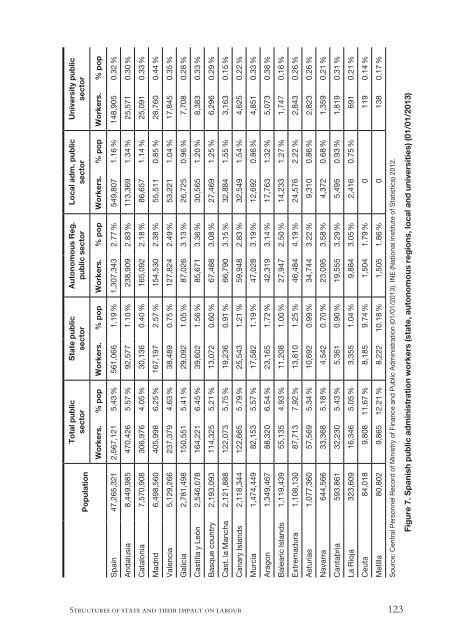
Population<br />
Total public<br />
sector<br />
State public<br />
sector<br />
Autonomous Reg.<br />
public sector<br />
Local adm. public<br />
sector<br />
University public<br />
sector<br />
Workers. % pop Workers. % pop Workers. % pop Workers. % pop Workers. % pop<br />
Spain 47,265,321 2,567,121 5.43 % 561,066 1.19 % 1,307,343 2.77 % 549,807 1.16 % 148,905 0.32 %<br />
Andalusia 8,449,985 470,426 5.57 % 92,577 1.10 % 238,909 2.83 % 113,369 1.34 % 25,571 0.30 %<br />
<strong>Catalonia</strong> 7,570,908 306,976 4.05 % 30,136 0.40 % 165,092 2.18 % 86,657 1.14 % 25,091 0.33 %<br />
Madrid 6,498,560 405,998 6.25 % 167,197 2.57 % 154,530 2.38 % 55,511 0.85 % 28,760 0.44 %<br />
Valencia 5,129,266 237,379 4.63 % 38,489 0.75 % 127,824 2.49 % 53,221 1.04 % 17,845 0.35 %<br />
Galicia 2,781,498 150,551 5.41 % 29,092 1.05 % 87,026 3.13 % 26,725 0.96 % 7,708 0.28 %<br />
Castilla y León 2,546,078 164,221 6.45 % 39,602 1.56 % 85,671 3.36 % 30,565 1.20 % 8,383 0.33 %<br />
Basque country 2,193,093 114,325 5.21 % 13,072 0.60 % 67,488 3.08 % 27,469 1.25 % 6,296 0.29 %<br />
Cast. la Mancha 2,121,888 122,073 5.75 % 19,236 0.91 % 66,790 3.15 % 32,884 1.55 % 3,163 0.15 %<br />
Canary Islands 2,118,344 122,665 5.79 % 25,543 1.21 % 59,948 2.83 % 32,549 1.54 % 4,625 0.22 %<br />
Murcia 1,474,449 82,153 5.57 % 17,582 1.19 % 47,028 3.19 % 12,692 0.86 % 4,851 0.33 %<br />
Aragon 1,349,467 88,320 6.54 % 23,165 1.72 % 42,319 3.14 % 17,763 1.32 % 5,073 0.38 %<br />
Balearic Islands 1,119,439 55,135 4.93 % 11,208 1.00 % 27,947 2.50 % 14,233 1.27 % 1,747 0.16 %<br />
Extremadura 1,108,130 87,713 7.92 % 13,810 1.25 % 46,484 4.19 % 24,576 2.22 % 2,843 0.26 %<br />
Asturias 1,077,360 57,569 5.34 % 10,692 0.99 % 34,744 3.22 % 9,310 0.86 % 2,823 0.26 %<br />
Navarra 644,566 33,368 5.18 % 4,542 0.70 % 23,095 3.58 % 4,372 0.68 % 1,359 0.21 %<br />
Cantabria 593,861 32,230 5.43 % 5,361 0.90 % 19,555 3.29 % 5,495 0.93 % 1,819 0.31 %<br />
La Rioja 323,609 16,346 5.05 % 3,355 1.04 % 9,884 3.05 % 2,416 0.75 % 691 0.21 %<br />
Ceuta 84,018 9,808 11.67 % 8,185 9.74 % 1,504 1.79 % 0 119 0.14 %<br />
Melilla 80,802 9,865 12.21 % 8,222 10.18 % 1,505 1.86 % 0 138 0.17 %<br />
Source: Central Personnel Record <strong>of</strong> Ministry <strong>of</strong> Finance and Public Administration (01/01/2013). INE (National Institute <strong>of</strong> Statistics) 2012.<br />
Figure 7. Spanish public administration workers (state, autonomous regions, local and universities) (01/01/2013)<br />
Structures <strong>of</strong> state and their impact on labour 123