- Page 2 and 3:
Beginning Oracle Database 11g Admin
- Page 4 and 5:
For Michelle. “Oh Fame!—if I e
- Page 6 and 7:
PART III Database Support CHAPTE
- Page 8 and 9:
viii CONTENTS CHAPTER 2 SQL and PL/
- Page 10 and 11:
x CONTENTS Client Installations ...
- Page 12 and 13:
xii CONTENTS Data Loading .........
- Page 14 and 15:
xiv CONTENTS Practical Demonstratio
- Page 16 and 17:
xvi CONTENTS PART IV Database Tu
- Page 18 and 19:
About the Author IGGY FERNANDEZ has
- Page 20 and 21:
Acknowledgments I would like to tha
- Page 22 and 23:
xxvi INTRODUCTION Who This Book Is
- Page 24 and 25:
xxviii INTRODUCTION performing afte
- Page 26 and 27:
xxx INTRODUCTION Chapter 14: Databa
- Page 28 and 29:
PART I Database Concepts
- Page 30 and 31:
4 CHAPTER 1 RELATIONAL DATABASE MA
- Page 32 and 33:
6 CHAPTER 1 RELATIONAL DATABASE MA
- Page 34 and 35:
8 CHAPTER 1 RELATIONAL DATABASE MA
- Page 36 and 37:
10 CHAPTER 1 RELATIONAL DATABASE M
- Page 38 and 39:
12 CHAPTER 1 RELATIONAL DATABASE M
- Page 40 and 41:
14 CHAPTER 1 RELATIONAL DATABASE M
- Page 42 and 43:
16 CHAPTER 1 RELATIONAL DATABASE M
- Page 44 and 45:
18 CHAPTER 1 RELATIONAL DATABASE M
- Page 46 and 47:
20 CHAPTER 1 RELATIONAL DATABASE M
- Page 48 and 49:
22 CHAPTER 2 SQL AND PL/SQL As an
- Page 50 and 51:
24 CHAPTER 2 SQL AND PL/SQL Listin
- Page 52 and 53:
26 CHAPTER 2 SQL AND PL/SQL Data D
- Page 54 and 55:
28 CHAPTER 2 SQL AND PL/SQL The DE
- Page 56 and 57:
30 CHAPTER 2 SQL AND PL/SQL
- Page 58 and 59:
32 CHAPTER 2 SQL AND PL/SQL Listin
- Page 60 and 61:
34 CHAPTER 2 SQL AND PL/SQL The ve
- Page 62 and 63:
36 CHAPTER 2 SQL AND PL/SQL In Cha
- Page 64 and 65:
38 CHAPTER 2 SQL AND PL/SQL Introd
- Page 66 and 67:
40 CHAPTER 2 SQL AND PL/SQL Storin
- Page 68 and 69:
42 CHAPTER 2 SQL AND PL/SQL
- Page 70 and 71:
44 CHAPTER 2 SQL AND PL/SQL
- Page 72 and 73:
46 CHAPTER 2 SQL AND PL/SQL
- Page 74 and 75:
48 CHAPTER 2 SQL AND PL/SQL Exerci
- Page 76 and 77:
CHAPTER 3 Oracle Architecture Try t
- Page 78 and 79:
CHAPTER 3 ORACLE ARCHITECTURE 53 D
- Page 80 and 81:
CHAPTER 3 ORACLE ARCHITECTURE 55 T
- Page 82 and 83:
CHAPTER 3 ORACLE ARCHITECTURE 57 t
- Page 84 and 85:
CHAPTER 3 ORACLE ARCHITECTURE 59
- Page 86 and 87:
CHAPTER 3 ORACLE ARCHITECTURE 61
- Page 88 and 89:
PART II Database Implementation
- Page 90 and 91:
66 CHAPTER 4 PLANNING in a separat
- Page 92 and 93:
68 CHAPTER 4 PLANNING Free to Down
- Page 94 and 95:
70 CHAPTER 4 PLANNING Architectura
- Page 96 and 97:
72 CHAPTER 4 PLANNING resources an
- Page 98 and 99:
74 CHAPTER 4 PLANNING Disk Sizing
- Page 100 and 101:
76 CHAPTER 4 PLANNING Disk Speed P
- Page 102 and 103:
78 CHAPTER 4 PLANNING t
- Page 104 and 105:
CHAPTER 5 Software Installation The
- Page 106 and 107:
CHAPTER 5 SOFTWARE INSTALLATION 83
- Page 108 and 109:
CHAPTER 5 SOFTWARE INSTALLATION 85
- Page 110 and 111:
CHAPTER 5 SOFTWARE INSTALLATION 87
- Page 112 and 113:
CHAPTER 5 SOFTWARE INSTALLATION 89
- Page 114 and 115:
CHAPTER 5 SOFTWARE INSTALLATION 91
- Page 116 and 117:
CHAPTER 5 SOFTWARE INSTALLATION 93
- Page 118 and 119:
96 CHAPTER 6 DATABASE CREATION Nor
- Page 120 and 121:
98 CHAPTER 6 DATABASE CREATION Fig
- Page 122 and 123:
100 CHAPTER 6 DATABASE CREATION 6.
- Page 124 and 125:
102 CHAPTER 6 DATABASE CREATION Th
- Page 126 and 127:
104 CHAPTER 6 DATABASE CREATION Fi
- Page 128 and 129:
106 CHAPTER 6 DATABASE CREATION Fi
- Page 130 and 131:
108 CHAPTER 6 DATABASE CREATION Fi
- Page 132 and 133:
110 CHAPTER 6 DATABASE CREATION Fi
- Page 134 and 135:
112 CHAPTER 6 DATABASE CREATION In
- Page 136 and 137:
114 CHAPTER 6 DATABASE CREATION Fi
- Page 138 and 139:
116 CHAPTER 6 DATABASE CREATION Fi
- Page 140 and 141:
118 CHAPTER 6 DATABASE CREATION Ta
- Page 142 and 143:
120 CHAPTER 6 DATABASE CREATION Po
- Page 144 and 145:
122 CHAPTER 6 DATABASE CREATION
- Page 146 and 147:
124 CHAPTER 6 DATABASE CREATION
- Page 148 and 149:
126 CHAPTER 6 DATABASE CREATION
- Page 150 and 151:
128 CHAPTER 6 DATABASE CREATION
- Page 152 and 153:
130 CHAPTER 6 DATABASE CREATION
- Page 154 and 155:
132 CHAPTER 7 PHYSICAL DATABASE DE
- Page 156 and 157:
134 CHAPTER 7 PHYSICAL DATABASE DE
- Page 158 and 159:
136 CHAPTER 7 PHYSICAL DATABASE DE
- Page 160 and 161:
138 CHAPTER 7 PHYSICAL DATABASE DE
- Page 162 and 163:
140 CHAPTER 7 PHYSICAL DATABASE DE
- Page 164 and 165:
142 CHAPTER 7 PHYSICAL DATABASE DE
- Page 166 and 167:
144 CHAPTER 7 PHYSICAL DATABASE DE
- Page 168 and 169:
146 CHAPTER 7 PHYSICAL DATABASE DE
- Page 170 and 171:
148 CHAPTER 7 PHYSICAL DATABASE DE
- Page 172 and 173:
150 CHAPTER 7 PHYSICAL DATABASE DE
- Page 174 and 175:
152 CHAPTER 8 USER MANAGEMENT AND
- Page 176 and 177:
154 CHAPTER 8 USER MANAGEMENT AND
- Page 178 and 179:
156 CHAPTER 8 USER MANAGEMENT AND
- Page 180 and 181:
158 CHAPTER 8 USER MANAGEMENT AND
- Page 182 and 183: 160 CHAPTER 8 USER MANAGEMENT AND
- Page 184 and 185: 162 CHAPTER 8 USER MANAGEMENT AND
- Page 186 and 187: 164 CHAPTER 8 USER MANAGEMENT AND
- Page 188 and 189: 166 CHAPTER 8 USER MANAGEMENT AND
- Page 190 and 191: 168 CHAPTER 8 USER MANAGEMENT AND
- Page 192 and 193: 170 CHAPTER 8 USER MANAGEMENT AND
- Page 194 and 195: 172 CHAPTER 8 USER MANAGEMENT AND
- Page 196 and 197: 174 CHAPTER 8 USER MANAGEMENT AND
- Page 198 and 199: 176 CHAPTER 8 USER MANAGEMENT AND
- Page 200 and 201: 178 CHAPTER 8 USER MANAGEMENT AND
- Page 202 and 203: 180 CHAPTER 8 USER MANAGEMENT AND
- Page 204 and 205: PART III Database Support
- Page 206 and 207: 186 CHAPTER 9 TAKING CONTROL Listi
- Page 208 and 209: 188 CHAPTER 9 TAKING CONTROL Figur
- Page 210 and 211: 190 CHAPTER 9 TAKING CONTROL Figur
- Page 212 and 213: 192 CHAPTER 9 TAKING CONTROL Figur
- Page 214 and 215: 194 CHAPTER 9 TAKING CONTROL Figur
- Page 216 and 217: 196 CHAPTER 9 TAKING CONTROL
- Page 218 and 219: 198 CHAPTER 9 TAKING CONTROL
- Page 220 and 221: 200 CHAPTER 9 TAKING CONTROL
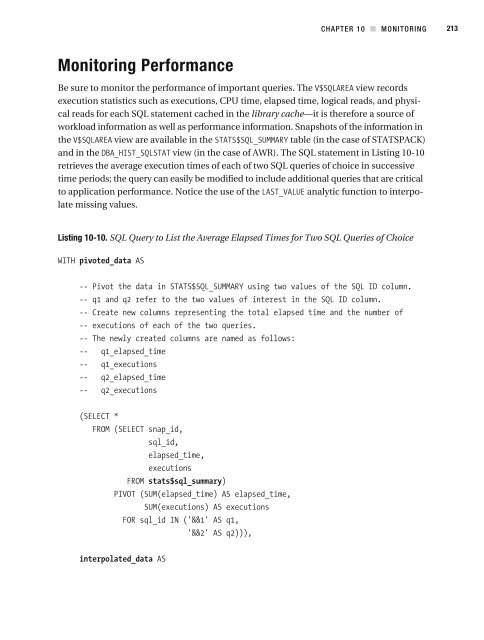
- Page 222 and 223: 202 CHAPTER 10 MONITORING Monitori
- Page 224 and 225: 204 CHAPTER 10 MONITORING L
- Page 226 and 227: 206 CHAPTER 10 MONITORING
- Page 228 and 229: 208 CHAPTER 10 MONITORING Listing
- Page 230 and 231: 210 CHAPTER 10 MONITORING The vie
- Page 234 and 235: 214 CHAPTER 10 MONITORING
- Page 236 and 237: 216 CHAPTER 10 MONITORING
- Page 238 and 239: 218 CHAPTER 10 MONITORING
- Page 240 and 241: 220 CHAPTER 10 MONITORING Exercise
- Page 242 and 243: CHAPTER 11 Fixing Problems Rise and
- Page 244 and 245: CHAPTER 11 FIXING PROBLEMS 225 3.
- Page 246 and 247: CHAPTER 11 FIXING PROBLEMS 227 Not
- Page 248 and 249: CHAPTER 11 FIXING PROBLEMS 229
- Page 250 and 251: CHAPTER 11 FIXING PROBLEMS 231 One
- Page 252 and 253: CHAPTER 11 FIXING PROBLEMS 233 Fig
- Page 254 and 255: CHAPTER 11 FIXING PROBLEMS 235 Fig
- Page 256 and 257: CHAPTER 11 FIXING PROBLEMS 237 Fig
- Page 258 and 259: CHAPTER 11 FIXING PROBLEMS 239 Rem
- Page 260 and 261: CHAPTER 11 FIXING PROBLEMS 241 A v
- Page 262 and 263: CHAPTER 11 FIXING PROBLEMS 243 Con
- Page 264 and 265: CHAPTER 11 FIXING PROBLEMS 245 I
- Page 266 and 267: CHAPTER 11 FIXING PROBLEMS 247 The
- Page 268 and 269: CHAPTER 11 FIXING PROBLEMS 249 Nex
- Page 270 and 271: CHAPTER 11 FIXING PROBLEMS 251 Fig
- Page 272 and 273: CHAPTER 11 FIXING PROBLEMS 253
- Page 274 and 275: CHAPTER 12 Backups As to our Conduc
- Page 276 and 277: CHAPTER 12 BACKUPS 257 resources u
- Page 278 and 279: CHAPTER 12 BACKUPS 259 backup mana
- Page 280 and 281: CHAPTER 12 BACKUPS 261 Oracle-Mana
- Page 282 and 283:
CHAPTER 12 BACKUPS 263 RMAN procee
- Page 284 and 285:
CHAPTER 12 BACKUPS 265
- Page 286 and 287:
CHAPTER 12 BACKUPS 267
- Page 288 and 289:
CHAPTER 12 BACKUPS 269 A concise
- Page 290 and 291:
CHAPTER 12 BACKUPS 271
- Page 292 and 293:
CHAPTER 12 BACKUPS 273
- Page 294 and 295:
CHAPTER 12 BACKUPS 275 Figure 12-2
- Page 296 and 297:
CHAPTER 12 BACKUPS 277
- Page 298 and 299:
CHAPTER 13 Recovery These Officers,
- Page 300 and 301:
CHAPTER 13 RECOVERY 281 base admin
- Page 302 and 303:
CHAPTER 13 RECOVERY 283 Flashbac
- Page 304 and 305:
CHAPTER 13 RECOVERY 285
- Page 306 and 307:
CHAPTER 13 RECOVERY 287
- Page 308 and 309:
CHAPTER 13 RECOVERY 289 Figure 13-
- Page 310 and 311:
CHAPTER 13 RECOVERY 291 Note
- Page 312 and 313:
CHAPTER 13 RECOVERY 293
- Page 314 and 315:
CHAPTER 13 RECOVERY 295 Nex
- Page 316 and 317:
CHAPTER 13 RECOVERY 297
- Page 318 and 319:
CHAPTER 13 RECOVERY 299 Figure 13-
- Page 320 and 321:
CHAPTER 13 RECOVERY 301 Documentat
- Page 322 and 323:
CHAPTER 13 RECOVERY 303 g Lic
- Page 324 and 325:
CHAPTER 14 Database Maintenance “
- Page 326 and 327:
CHAPTER 14 DATABASE MAINTENANCE 30
- Page 328 and 329:
CHAPTER 14 DATABASE MAINTENANCE 30
- Page 330 and 331:
CHAPTER 14 DATABASE MAINTENANCE 31
- Page 332 and 333:
CHAPTER 14 DATABASE MAINTENANCE 31
- Page 334 and 335:
CHAPTER 14 DATABASE MAINTENANCE 31
- Page 336 and 337:
CHAPTER 14 DATABASE MAINTENANCE 31
- Page 338 and 339:
CHAPTER 14 DATABASE MAINTENANCE 31
- Page 340 and 341:
CHAPTER 14 DATABASE MAINTENANCE 32
- Page 342 and 343:
CHAPTER 14 DATABASE MAINTENANCE 32
- Page 344 and 345:
CHAPTER 14 DATABASE MAINTENANCE 32
- Page 346 and 347:
CHAPTER 14 DATABASE MAINTENANCE 32
- Page 348 and 349:
CHAPTER 14 DATABASE MAINTENANCE 32
- Page 350 and 351:
CHAPTER 15 The Big Picture and the
- Page 352 and 353:
CHAPTER 15 THE BIG PICTURE AND THE
- Page 354 and 355:
CHAPTER 15 THE BIG PICTURE AND THE
- Page 356 and 357:
CHAPTER 15 THE BIG PICTURE AND THE
- Page 358 and 359:
CHAPTER 15 THE BIG PICTURE AND THE
- Page 360 and 361:
CHAPTER 15 THE BIG PICTURE AND THE
- Page 362 and 363:
CHAPTER 15 THE BIG PICTURE AND THE
- Page 364 and 365:
CHAPTER 15 THE BIG PICTURE AND THE
- Page 366 and 367:
CHAPTER 15 THE BIG PICTURE AND THE
- Page 368 and 369:
CHAPTER 15 THE BIG PICTURE AND THE
- Page 370 and 371:
CHAPTER 15 THE BIG PICTURE AND THE
- Page 372 and 373:
CHAPTER 15 THE BIG PICTURE AND THE
- Page 374 and 375:
PART IV Database Tuning
- Page 376 and 377:
358 CHAPTER 16 INSTANCE TUNING “
- Page 378 and 379:
360 CHAPTER 16 INSTANCE TUNING 1.
- Page 380 and 381:
362 CHAPTER 16 INSTANCE TUNING
- Page 382 and 383:
364 CHAPTER 16 INSTANCE TUNING
- Page 384 and 385:
366 CHAPTER 16 INSTANCE TUNING V$S
- Page 386 and 387:
368 CHAPTER 16 INSTANCE TUNING
- Page 388 and 389:
370 CHAPTER 16 INSTANCE TUNING
- Page 390 and 391:
372 CHAPTER 16 INSTANCE TUNING It
- Page 392 and 393:
374 CHAPTER 16 INSTANCE TUNING
- Page 394 and 395:
376 CHAPTER 16 INSTANCE TUNING doc
- Page 396 and 397:
378 CHAPTER 16 INSTANCE TUNING
- Page 398 and 399:
380 CHAPTER 16 INSTANCE TUNING 17.
- Page 400 and 401:
382 CHAPTER 17 SQL TUNING Identify
- Page 402 and 403:
384 CHAPTER 17 SQL TUNING
- Page 404 and 405:
386 CHAPTER 17 SQL TUNING Indexes
- Page 406 and 407:
388 CHAPTER 17 SQL TUNING The most
- Page 408 and 409:
390 CHAPTER 17 SQL TUNING It is my
- Page 410 and 411:
392 CHAPTER 17 SQL TUNING
- Page 412 and 413:
394 CHAPTER 17 SQL TUNING Five row
- Page 414 and 415:
396 CHAPTER 17 SQL TUNING Let’s
- Page 416 and 417:
398 CHAPTER 17 SQL TUNING
- Page 418 and 419:
400 CHAPTER 17 SQL TUNING
- Page 420 and 421:
402 CHAPTER 17 SQL TUNING
- Page 422 and 423:
404 CHAPTER 17 SQL TUNING
- Page 424 and 425:
406 CHAPTER 17 SQL TUNING SQL
- Page 426 and 427:
408 CHAPTER 17 SQL TUNING Ext
- Page 428 and 429:
410 CHAPTER 17 SQL TUNING It’
- Page 430 and 431:
412 CHAPTER 17 SQL TUNING
- Page 432 and 433:
414 CHAPTER 17 SQL TUNING
- Page 434 and 435:
416 CHAPTER 17 SQL TUNING Lewis, J
- Page 436 and 437:
418 INDEX backout section, 349 back
- Page 438 and 439:
420 INDEX databases administration
- Page 440 and 441:
422 INDEX Enable Automatic Maintena
- Page 442 and 443:
424 INDEX Listener Configuration, 9
- Page 444 and 445:
426 INDEX Perl, 91-92 perl -v comma
- Page 446 and 447:
428 INDEX SHOW ALL command, 269 SHO
- Page 448:
430 INDEX user management creating