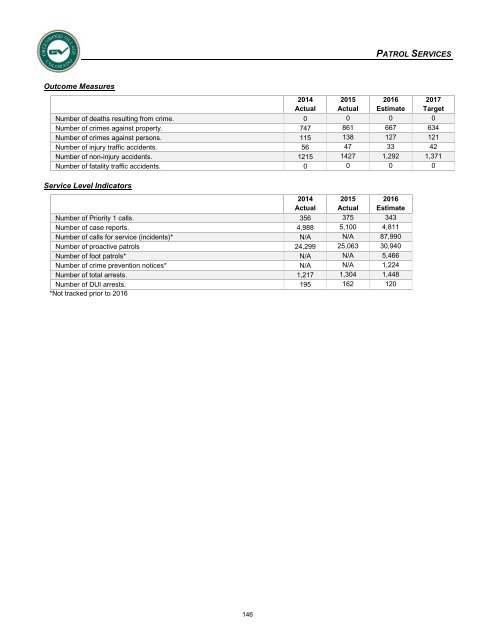
PATROL SERVICES Outcome Measures 2014 Actual 2015 Actual 2016 Estimate <strong>2017</strong> Target Number of deaths resulting from crime. 0 0 0 0 Number of crimes against property. 747 861 667 634 Number of crimes against persons. 115 138 127 121 Number of injury traffic accidents. 56 47 33 42 Number of non-injury accidents. 1215 1427 1,292 1,371 Number of fatality traffic accidents. 0 0 0 0 Service Level Indicators 2014 Actual 2015 Actual 2016 Estimate Number of Priority 1 calls. 356 375 343 Number of case reports. 4,988 5,100 4,811 Number of calls for service (incidents)* N/A N/A 87,990 Number of proactive patrols 24,299 25,063 30,940 Number of foot patrols* N/A N/A 5,466 Number of crime prevention notices* N/A N/A 1,224 Number of total arrests. 1,217 1,304 1,448 Number of DUI arrests. 195 162 120 *Not tracked prior to 2016 146
PATROL SERVICES Expenditure Detail 2015 Audited Actuals 2016 Amended <strong>Budget</strong> <strong>2017</strong> <strong>Adopted</strong> <strong>Budget</strong> % Change Personnel Regular Wages $ 4,318,921 $ 4,486,395 $ 4,465,853 -0.46% Longevity Service Award 36,345 41,065 41,460 0.96% Rate/Shift Differential 24,387 30,000 30,000 0.00% Extra Duty Assignment 262,253 260,000 460,000 76.92% Overtime Wages 227,480 185,000 213,000 15.14% Clothing Allowance 1,400 1,400 950 -32.14% Cleaning Allowance 28,460 28,500 28,000 -1.75% Social Security 7,864 25,156 25,323 0.66% Medicare 65,595 68,914 73,638 6.85% Unemployment Insurance - 17,942 - -100.00% Workers Compensation 130,652 151,110 153,327 1.47% FPPA Death & Disability 84,875 80,785 80,122 -0.82% Retirement Contributions 614,222 618,033 615,014 -0.49% Medical Insurance 594,518 564,888 526,599 -6.78% Dental Insurance 29,183 27,437 27,992 2.02% Insurance Waivers 12,596 12,550 14,950 19.12% Life/AD&D Insurance 10,874 16,154 16,086 -0.42% Disability Insurance 13,244 13,845 13,791 -0.39% Total Personnel 6,462,869 6,629,174 6,786,105 2.37% Purchased Services Professional Services 15,003 19,740 20,000 1.32% Catering/Dining Services 128 - - 0.00% Repair/Maintenance Services 639 2,700 2,700 0.00% Telecommunication Services 19,172 - - 0.00% Printing/Publication Services 81 2,450 2,450 0.00% Training/Education 3,761 4,360 5,080 16.51% Mileage/Travel 342 - - 0.00% Total Purchased Services 39,126 29,250 30,230 3.35% Supplies/Non-<strong>Capital</strong> Equipment <strong>Operating</strong> Supplies 3,327 3,648 3,648 0.00% Non-<strong>Capital</strong> Equipment 18,981 17,100 18,909 10.58% Uniforms/Safety Equipment 87,950 75,250 88,650 17.81% Total Supplies/Non-<strong>Capital</strong> Equipment 110,258 95,998 111,207 15.84% Total Expenditures $ 6,612,253 $ 6,754,422 $ 6,927,542 2.56% 147