Adopted 2017 Annual Operating & Capital Improvement Budget

You also want an ePaper? Increase the reach of your titles
YUMPU automatically turns print PDFs into web optimized ePapers that Google loves.
REVENUE ASSESSMENT<br />
Overview<br />
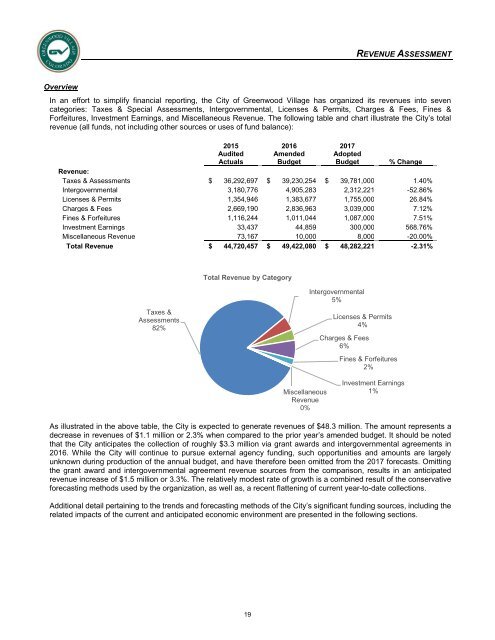
In an effort to simplify financial reporting, the City of Greenwood Village has organized its revenues into seven<br />
categories: Taxes & Special Assessments, Intergovernmental, Licenses & Permits, Charges & Fees, Fines &<br />
Forfeitures, Investment Earnings, and Miscellaneous Revenue. The following table and chart illustrate the City’s total<br />
revenue (all funds, not including other sources or uses of fund balance):<br />
2015<br />
Audited<br />
Actuals<br />
2016<br />
Amended<br />
<strong>Budget</strong><br />
<strong>2017</strong><br />
<strong>Adopted</strong><br />
<strong>Budget</strong><br />
% Change<br />
Revenue:<br />
Taxes & Assessments $ 36,292,697 $ 39,230,254 $ 39,781,000 1.40%<br />
Intergovernmental 3,180,776 4,905,283 2,312,221 -52.86%<br />
Licenses & Permits 1,354,946 1,383,677 1,755,000 26.84%<br />
Charges & Fees 2,669,190 2,836,963 3,039,000 7.12%<br />
Fines & Forfeitures 1,116,244 1,011,044 1,087,000 7.51%<br />
Investment Earnings 33,437 44,859 300,000 568.76%<br />
Miscellaneous Revenue 73,167 10,000 8,000 -20.00%<br />
Total Revenue $ 44,720,457 $ 49,422,080 $ 48,282,221 -2.31%<br />
Total Revenue by Category<br />
Intergovernmental<br />
5%<br />
Taxes &<br />
Assessments<br />
82%<br />
Licenses & Permits<br />
4%<br />
Charges & Fees<br />
6%<br />
Fines & Forfeitures<br />
2%<br />
Miscellaneous<br />
Revenue<br />
0%<br />
Investment Earnings<br />
1%<br />
As illustrated in the above table, the City is expected to generate revenues of $48.3 million. The amount represents a<br />
decrease in revenues of $1.1 million or 2.3% when compared to the prior year’s amended budget. It should be noted<br />
that the City anticipates the collection of roughly $3.3 million via grant awards and intergovernmental agreements in<br />
2016. While the City will continue to pursue external agency funding, such opportunities and amounts are largely<br />
unknown during production of the annual budget, and have therefore been omitted from the <strong>2017</strong> forecasts. Omitting<br />
the grant award and intergovernmental agreement revenue sources from the comparison, results in an anticipated<br />
revenue increase of $1.5 million or 3.3%. The relatively modest rate of growth is a combined result of the conservative<br />
forecasting methods used by the organization, as well as, a recent flattening of current year-to-date collections.<br />
Additional detail pertaining to the trends and forecasting methods of the City’s significant funding sources, including the<br />
related impacts of the current and anticipated economic environment are presented in the following sections.<br />
19