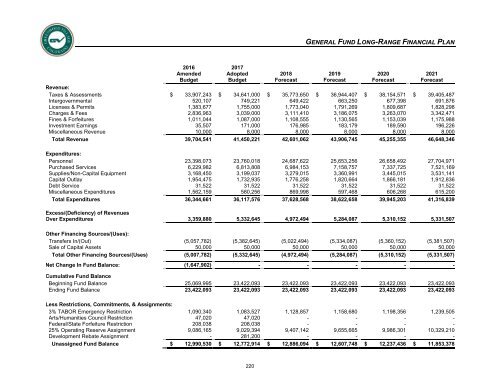
GENERAL FUND LONG-RANGE FINANCIAL PLAN 2016 Amended <strong>Budget</strong> <strong>2017</strong> <strong>Adopted</strong> <strong>Budget</strong> 2018 Forecast 2019 Forecast 2020 Forecast 2021 Forecast Revenue: Taxes & Assessments $ 33,907,243 $ 34,641,000 $ 35,773,650 $ 36,944,407 $ 38,154,571 $ 39,405,487 Intergovernmental 520,107 749,221 649,422 663,250 677,398 691,876 Licenses & Permits 1,383,677 1,755,000 1,773,040 1,791,269 1,809,687 1,828,298 Charges & Fees 2,836,963 3,039,000 3,111,410 3,186,075 3,263,070 3,342,471 Fines & Forfeitures 1,011,044 1,087,000 1,108,555 1,130,565 1,153,039 1,175,988 Investment Earnings 35,507 171,000 176,985 183,179 189,590 196,226 Miscellaneous Revenue 10,000 8,000 8,000 8,000 8,000 8,000 Total Revenue 39,704,541 41,450,221 42,601,062 43,906,745 45,255,355 46,648,346 Expenditures: Personnel 23,398,073 23,760,018 24,687,622 25,653,256 26,658,492 27,704,971 Purchased Services 6,229,982 6,813,808 6,984,153 7,158,757 7,337,725 7,521,169 Supplies/Non-<strong>Capital</strong> Equipment 3,168,450 3,199,037 3,279,015 3,360,991 3,445,015 3,531,141 <strong>Capital</strong> Outlay 1,954,475 1,732,935 1,776,258 1,820,664 1,866,181 1,912,836 Debt Service 31,522 31,522 31,522 31,522 31,522 31,522 Miscellaneous Expenditures 1,562,159 580,256 869,998 597,468 606,268 615,200 Total Expenditures 36,344,661 36,117,576 37,628,568 38,622,658 39,945,203 41,316,839 Excess/(Deficiency) of Revenues Over Expenditures 3,359,880 5,332,645 4,972,494 5,284,087 5,310,152 5,331,507 Other Financing Sources/(Uses): Transfers In/(Out) (5,057,782) (5,382,645) (5,022,494) (5,334,087) (5,360,152) (5,381,507) Sale of <strong>Capital</strong> Assets 50,000 50,000 50,000 50,000 50,000 50,000 Total Other Financing Sources/(Uses) (5,007,782) (5,332,645) (4,972,494) (5,284,087) (5,310,152) (5,331,507) Net Change In Fund Balance: (1,647,902) - - - - - Cumulative Fund Balance Beginning Fund Balance 25,069,995 23,422,093 23,422,093 23,422,093 23,422,093 23,422,093 Ending Fund Balance 23,422,093 23,422,093 23,422,093 23,422,093 23,422,093 23,422,093 Less Restrictions, Commitments, & Assignments: 3% TABOR Emergency Restriction 1,090,340 1,083,527 1,128,857 1,158,680 1,198,356 1,239,505 Arts/Humanities Council Restriction 47,020 47,020 - - - - Federal/State Forfeiture Restriction 208,038 208,038 - - - - 25% <strong>Operating</strong> Reserve Assignment 9,086,165 9,029,394 9,407,142 9,655,665 9,986,301 10,329,210 Development Rebate Assignment - 281,200 - - - - Unassigned Fund Balance $ 12,990,530 $ 12,772,914 $ 12,886,094 $ 12,607,748 $ 12,237,436 $ 11,853,378 220
CAPITAL PROJECTS FUND LONG-RANGE FINANCIAL PLAN 2016 Amended <strong>Budget</strong> <strong>2017</strong> <strong>Adopted</strong> <strong>Budget</strong> 2018 Forecast 2019 Forecast 2020 Forecast 2021 Forecast Revenue: Taxes & Assessments $ 5,224,163 $ 5,038,000 $ 5,157,701 $ 5,280,072 $ 5,400,750 $ 5,529,917 Intergovernmental 4,385,176 1,563,000 2,223,975 1,960,898 1,623,796 2,062,697 Charges & Fees - - 127,426 36,550 500,000 - Investment Earnings 7,598 120,000 124,200 128,547 133,046 137,703 Total Revenue 9,616,937 6,721,000 7,633,302 7,406,067 7,657,592 7,730,317 Expenditures: Purchased Services 1,500 1,000 1,000 1,000 1,000 1,000 <strong>Capital</strong> Outlay 19,914,369 10,033,667 7,200,000 7,444,000 8,889,000 10,086,000 Miscellaneous Expenditures 2,618,097 - 478,800 - - - Total Expenditures 22,533,966 10,034,667 7,679,800 7,445,000 8,890,000 10,087,000 Excess/(Deficiency) of Revenues Over Expenditures (12,917,029) (3,313,667) (46,498) (38,933) (1,232,408) (2,356,683) Other Financing Sources/(Uses): Transfers In/(Out) 5,057,782 5,382,645 5,022,494 5,334,087 5,360,152 5,381,507 Total Other Financing Sources/(Uses) 5,057,782 5,382,645 5,022,494 5,334,087 5,360,152 5,381,507 Net Change In Fund Balance: (7,859,247) 2,068,978 4,975,996 5,295,154 4,127,744 3,024,824 Cumulative Fund Balance Beginning Fund Balance 16,873,007 9,013,760 11,082,738 16,058,734 21,353,888 25,481,632 Ending Fund Balance 9,013,760 11,082,738 16,058,734 21,353,888 25,481,632 28,506,456 Less Restrictions, Commitments, & Assignments: Open Space Tax Restriction 87,618 168,618 562,953 1,860 324,282 61,489 Lottery Proceeds Restriction 61,379 55,379 231,989 15,478 147,426 32,103 <strong>Capital</strong> Project Commitment 2,648,429 2,063,607 4,847,458 10,820,216 14,393,590 17,696,530 Open Space Acquisition Assignment 391,334 491,334 591,334 691,334 791,334 891,334 Maintenance Facility Phase II Assignment 5,825,000 7,825,000 9,825,000 9,825,000 9,825,000 9,825,000 Development Rebate Assignment - 478,800 - - - - Unassigned Fund Balance $ - $ - $ - $ - $ - $ - 221
- Page 1:
Greenwood Village www.greenwoodvill
- Page 4 and 5:
TABLE OF CONTENTS Appendix Long-Ran
- Page 6 and 7:
DISTINGUISHED BUDGET PRESENTATION A
- Page 8 and 9:
GOVERNMENT PROFILE Organizational C
- Page 10 and 11:
GOVERNMENT PROFILE Organizational P
- Page 12 and 13:
GOVERNMENT PROFILE appropriations r
- Page 14 and 15:
COMMUNITY PROFILE Transportation As
- Page 16 and 17:
COMMUNITY PROFILE Economic Developm
- Page 18 and 19:
ECONOMIC INDICATORS Consumer Confid
- Page 20 and 21:
BUDGET PROCESS Budget Calendar Janu
- Page 22 and 23:
BUDGET PROCESS Capital Project Fund
- Page 24 and 25:
REVENUE ASSESSMENT Taxes & Special
- Page 26 and 27:
REVENUE ASSESSMENT discussions with
- Page 28 and 29:
REVENUE ASSESSMENT and park use. Re
- Page 30 and 31:
REVENUE ASSESSMENT Miscellaneous Re
- Page 32 and 33:
EXPENDITURE ASSESSMENT Personnel Pe
- Page 34 and 35:
EXPENDITURE ASSESSMENT Capital Outl
- Page 36 and 37:
OTHER SOURCES & USES Overview Since
- Page 38 and 39:
FUND BALANCE ANALYSIS 2017 Beginnin
- Page 40 and 41:
CITY-WIDE REVENUE DETAIL 2015 Audit
- Page 42 and 43:
CITY-WIDE EXPENDITURE DETAIL 2015 A
- Page 44 and 45:
FUND/DEPARTMENT APPROPRIATIONS Appr
- Page 46 and 47:
GENERAL FUND FINANCIAL SUMMARY Reve
- Page 48 and 49:
GENERAL FUND REVENUE DETAIL 2015 Au
- Page 50 and 51:
GENERAL FUND EXPENDITURE DETAIL 201
- Page 52 and 53:
MAYOR & COUNCIL Expenditure Detail
- Page 54 and 55:
CITY MANAGEMENT Personnel & Financi
- Page 56 and 57:
CITY MANAGER’S OFFICE Statement o
- Page 58 and 59:
COMMUNITY OUTREACH Statement of Pur
- Page 60 and 61:
COMMUNITY OUTREACH Expenditure Deta
- Page 62 and 63:
CITY ATTORNEY Personnel & Financial
- Page 64 and 65:
60
- Page 66 and 67:
MUNICIPAL JUDGE Expenditure Detail
- Page 68 and 69:
ADMINISTRATIVE SERVICES Personnel &
- Page 70 and 71:
ADMINISTRATION Statement of Purpose
- Page 72 and 73:
INFORMATION MANAGEMENT SERVICES Sta
- Page 74 and 75:
MUNICIPAL COURT SERVICES Statement
- Page 76 and 77:
HUMAN RESOURCE SERVICES Statement o
- Page 78 and 79:
HUMAN RESOURCE SERVICES Expenditure
- Page 80 and 81:
SHARED TECHNOLOGY SERVICES Statemen
- Page 82 and 83:
SHARED TECHNOLOGY SERVICES Expendit
- Page 84 and 85:
80
- Page 86 and 87:
FINANCE Personnel & Financial Summa
- Page 88 and 89:
ADMINISTRATION Statement of Purpose
- Page 90 and 91:
ACCOUNTING & FINANCIAL REPORTING St
- Page 92 and 93:
ACCOUNTING & FINANCIAL REPORTING Ex
- Page 94 and 95:
TAXPAYER SERVICES Expenditure Detai
- Page 96 and 97:
COMMUNITY DEVELOPMENT Personnel & F
- Page 98 and 99:
ADMINISTRATION Statement of Purpose
- Page 100 and 101:
PLANNING Statement of Purpose The P
- Page 102 and 103:
BUILDING SAFETY Statement of Purpos
- Page 104 and 105:
NEIGHBORHOOD SERVICES Statement of
- Page 106 and 107:
NEIGHBORHOOD SERVICES Expenditure D
- Page 108 and 109:
BUILDING SERVICES Service Level Ind
- Page 110 and 111:
106
- Page 112 and 113:
PARKS, TRAILS & RECREATION Organiza
- Page 114 and 115:
PARKS, TRAILS & RECREATION Explanat
- Page 116 and 117:
ADMINISTRATION Statement of Purpose
- Page 118 and 119:
ADMINISTRATION Variance Justificati
- Page 120 and 121:
RECREATION Outcome Measures Adult P
- Page 122 and 123:
RECREATION Variance Justification
- Page 124 and 125:
CULTURAL ARTS Goals/Objectives In 2
- Page 126 and 127:
CULTURAL ARTS Variance Justificatio
- Page 128 and 129:
PARKS, TRAILS & OPEN SPACE Expendit
- Page 130 and 131:
PARKS & TRAILS MAINTENANCE Expendit
- Page 132 and 133:
PARKS & TRAILS MAINTENANCE Expendit
- Page 134 and 135:
PARKS & TRAILS MAINTENANCE Expendit
- Page 136 and 137:
PARKS & TRAILS MAINTENANCE Expendit
- Page 138 and 139:
134
- Page 140 and 141:
POLICE Personnel & Financial Summar
- Page 142 and 143:
ADMINISTRATION Statement of Purpose
- Page 144 and 145:
ADMINISTRATION Variance Justificati
- Page 146 and 147:
SUPPORT SERVICES Outcome Measures R
- Page 148 and 149:
SUPPORT SERVICES Variance Justifica
- Page 150 and 151:
PATROL SERVICES Outcome Measures 20
- Page 152 and 153:
PATROL SERVICES Variance Justificat
- Page 154 and 155:
DETECTIVE SERVICES Expenditure Deta
- Page 156 and 157:
152
- Page 158 and 159:
PUBLIC WORKS Organizational Chart D
- Page 160 and 161:
PUBLIC WORKS In personnel, changes
- Page 162 and 163:
ADMINISTRATION Outcome Measures 201
- Page 164 and 165:
ADMINISTRATION Variance Justificati
- Page 166 and 167:
ENVIRONMENTAL SERVICES Service Leve
- Page 168 and 169:
ENVIRONMENTAL SERVICES Communicati
- Page 170 and 171:
TRANSPORTATION Outcome Measures 201
- Page 172 and 173:
TRANSPORTATION Variance Justificati
- Page 174 and 175: SNOW & ICE CONTROL Expenditure Deta
- Page 176 and 177: ROADS Expenditure Detail 2015 Audit
- Page 178 and 179: FLEET MANAGEMENT Statement of Purpo
- Page 180 and 181: FLEET MANAGEMENT Expenditure Detail
- Page 182 and 183: 178
- Page 184 and 185: SEWER GENERAL IMPROVEMENT DISTRICT
- Page 186 and 187: SEWER GENERAL IMPROVEMENT DISTRICT
- Page 188 and 189: CAPITAL PROJECTS FUND FINANCIAL SUM
- Page 190 and 191: CAPITAL PROJECTS FUND EXPENDITURE D
- Page 192 and 193: FIVE-YEAR CAPITAL PROJECT SUMMARY 2
- Page 194 and 195: PROJECT DETAILS 2017-2021 Capital I
- Page 196 and 197: PROJECT DETAILS 2017-2021 Capital I
- Page 198 and 199: PROJECT DETAILS 2017-2021 Capital I
- Page 200 and 201: PROJECT DETAILS 2017-2021 Capital I
- Page 202 and 203: PROJECT DETAILS 2017-2021 Capital I
- Page 204 and 205: PROJECT DETAILS 2017-2021 Capital I
- Page 206 and 207: PROJECT DETAILS 2017-2021 Capital I
- Page 208 and 209: PROJECT DETAILS 2017-2021 Capital I
- Page 210 and 211: PROJECT DETAILS 2017-2021 Capital I
- Page 212 and 213: PROJECT DETAILS 2017-2021 Capital I
- Page 214 and 215: PROJECT DETAILS 2017-2021 Capital I
- Page 216 and 217: PROJECT DETAILS 2017-2021 Capital I
- Page 218 and 219: PROJECT DETAILS 2017-2021 Capital I
- Page 220 and 221: PROJECT DETAILS 2017-2021 Capital I
- Page 222 and 223: 218
- Page 226 and 227: PERSONNEL SUMMARY Full-Time Equival
- Page 228 and 229: PERSONNEL SUMMARY 2015 Audited Actu
- Page 230 and 231: FINANCIAL POLICIES Accounting, Audi
- Page 232 and 233: GLOSSARY OF TERMS Acronyms CAFR: CI
- Page 234 and 235: GLOSSARY OF TERMS Contractual Servi
- Page 236 and 237: GLOSSARY OF TERMS Service Level Sou
- Page 238 and 239: 234
- Page 240: 236