
You also want an ePaper? Increase the reach of your titles
YUMPU automatically turns print PDFs into web optimized ePapers that Google loves.
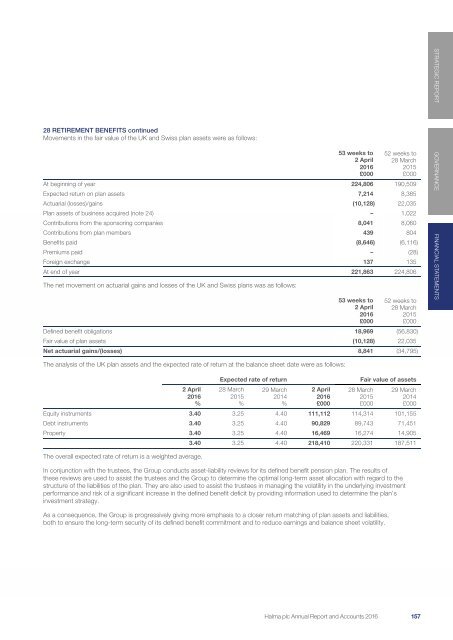
Notes to the Accounts continued<br />
28 RETIREMENT BENEFITS continued<br />
Movements in the fair value of the UK and Swiss plan assets were as follows:<br />
The net movement on actuarial gains and losses of the UK and Swiss plans was as follows:<br />
53 weeks to<br />
2 April<br />
<strong>2016</strong><br />
£000<br />
52 weeks to<br />
28 March<br />
2015<br />
£000<br />
At beginning of year 224,806 190,509<br />
Expected return on plan assets 7,214 8,385<br />
Actuarial (losses)/gains (10,128) 22,035<br />
Plan assets of business acquired (note 24) – 1,022<br />
Contributions from the sponsoring companies 8,041 8,060<br />
Contributions from plan members 439 804<br />
Benefits paid (8,646) (6,116)<br />
Premiums paid – (28)<br />
Foreign exchange 137 135<br />
At end of year 221,863 224,806<br />
53 weeks to<br />
2 April<br />
<strong>2016</strong><br />
£000<br />
52 weeks to<br />
28 March<br />
2015<br />
£000<br />
Defined benefit obligations 18,969 (56,830)<br />
Fair value of plan assets (10,128) 22,035<br />
Net actuarial gains/(losses) 8,841 (34,795)<br />
STRATEGIC REPORT GOVERNANCE FINANCIAL STATEMENTS<br />
The analysis of the UK plan assets and the expected rate of return at the balance sheet date were as follows:<br />
2 April<br />
<strong>2016</strong><br />
%<br />
The overall expected rate of return is a weighted average.<br />
Expected rate of return<br />
28 March<br />
2015<br />
%<br />
29 March<br />
2014<br />
%<br />
2 April<br />
<strong>2016</strong><br />
£000<br />
Fair value of assets<br />
28 March<br />
2015<br />
£000<br />
In conjunction with the trustees, the Group conducts asset-liability reviews for its defined benefit pension plan. The results of<br />
these reviews are used to assist the trustees and the Group to determine the optimal long-term asset allocation with regard to the<br />
structure of the liabilities of the plan. They are also used to assist the trustees in managing the volatility in the underlying investment<br />
performance and risk of a significant increase in the defined benefit deficit by providing information used to determine the plan’s<br />
investment strategy.<br />
As a consequence, the Group is progressively giving more emphasis to a closer return matching of plan assets and liabilities,<br />
both to ensure the long-term security of its defined benefit commitment and to reduce earnings and balance sheet volatility.<br />
29 March<br />
2014<br />
£000<br />
Equity instruments 3.40 3.25 4.40 111,112 114,314 101,155<br />
Debt instruments 3.40 3.25 4.40 90,829 89,743 71,451<br />
Property 3.40 3.25 4.40 16,469 16,274 14,905<br />
3.40 3.25 4.40 218,410 220,331 187,511<br />
<strong>Halma</strong> plc Annual Report and Accounts <strong>2016</strong> 157 155