
Create successful ePaper yourself
Turn your PDF publications into a flip-book with our unique Google optimized e-Paper software.
Financial Review continued<br />
Asia Pacific revenue grew by 7%. Medical<br />
and Environmental & Analysis delivered<br />
very good growth in Asia Pacific, leading<br />
to 10% growth in China, and together with<br />
Infrastructure Safety showed strong growth<br />
in India. Process Safety was affected by a<br />
slowdown in Australia. Africa, Near and<br />
Middle East grew by 27% with all sectors<br />
delivering growth and a very strong increase<br />
in the Middle East for Infrastructure Safety.<br />
There was revenue decline of 17% in Other<br />
countries with weak trading across South<br />
America, following last year’s major oil and<br />
gas related contract for Process Safety.<br />
In total, revenue grew from territories<br />
outside UK/Mainland Europe/USA<br />
by 7% although slightly behind our 10%<br />
growth target for such revenue. This<br />
compares with 13% growth in revenue<br />
in UK/Mainland Europe/USA.<br />
CONTINUED HIGH RETURNS<br />
<strong>Halma</strong>’s Return on Sales 2 has exceeded<br />
16% for over 30 consecutive years. We<br />
aim to deliver Return on Sales in the range<br />
of 18-22%. This year Return on Sales was<br />
20.6% (2015: 21.2%). Return on Sales for<br />
Process Safety reduced this year due<br />
to tough trading conditions but remains<br />
at the high rate of 25% with an improved<br />
performance in the second half. Medical<br />
and Infrastructure Safety sectors remained<br />
broadly in line with last year. Environmental<br />
& Analysis improved profitability as expected<br />
and exceeded 18% Return on Sales. Higher<br />
financing costs also reduced Return on Sales.<br />
Adjusted 1 gross margin (revenue less direct<br />
material and direct labour costs) remained<br />
steady at 64.2% (2015: 64.6%) continuing a<br />
long trend of stability and reflecting strong<br />
management of pricing and input costs.<br />
Return on Total Invested Capital 2 (ROTIC),<br />
the post-tax return on the Group’s total<br />
assets including all historic goodwill, was<br />
15.6% (2015: 16.3%). ROTIC remains well in<br />
excess of Group Weighted Average Cost of<br />
Capital (WACC) of 8.1% (2015: 7.6%).<br />
VOLATILITY IN CURRENCY<br />
MANAGED EFFECTIVELY<br />
<strong>Halma</strong> reports its results in Sterling. Our other<br />
key trading currencies are the US Dollar, Euro<br />
and to a lesser extent the Swiss Franc. Over<br />
40% of Group revenue is denominated in<br />
US Dollars and approximately 10% in Euros.<br />
The Group has both translational<br />
and transactional currency exposure.<br />
Translational exposures arise on the<br />
consolidation of overseas company results<br />
into Sterling. Transactional exposures arise<br />
where the currency of sale or purchase<br />
transactions differs from the functional<br />
currency in which each company prepares<br />
its local accounts.<br />
We take a neutral view of the future<br />
movements of currencies. After matching<br />
currency of revenue with currency costs<br />
wherever practical, forward exchange<br />
contracts are used to hedge a proportion<br />
(up to 75%) of the remaining forecast<br />
net transaction flows where there is a<br />
reasonable certainty of an exposure.<br />
We hedge up to 12 months and, in certain<br />
specific circumstances, up to 24 months<br />
forward. At 2 April <strong>2016</strong> over 50% of our next<br />
12 months’ currency trading transactions<br />
were hedged. There is a good degree of<br />
natural hedging within the Group in US<br />
Dollars but we typically spend less in Euros<br />
than we sell and so have a net exposure of<br />
approximately €35m at any time.<br />
We saw continued volatility in currencies<br />
throughout the year. In the first half year<br />
Sterling weakened on average by 8%<br />
relative to the US Dollar and strengthened<br />
12% against the Euro resulting in a 3%<br />
positive currency translation impact on<br />
revenue and 2% positive impact on profit.<br />
At that time we expected a broadly neutral<br />
currency translation impact for the year as<br />
a whole. However for the full year Sterling<br />
was 6% weaker relative to the US Dollar and<br />
8% stronger relative to the Euro. Currency<br />
translation therefore had a positive impact<br />
of 2% on both revenue and profit in the full<br />
year. The sectors benefiting most from<br />
positive currency translation in the full year<br />
were Medical and Environmental & Analysis.<br />
Based on the current mix of currency<br />
denominated revenue and profit, a 1%<br />
movement in the US Dollar relative to<br />
Sterling changes revenue by £3.4m and<br />
profit by £0.7m. Similarly, a 1% movement<br />
in the Euro changes revenue by £0.9m<br />
and profit by £0.2m.<br />
Since the start of <strong>2016</strong>, we have seen Sterling<br />
weaken and then strengthen against both<br />
the US Dollar and the Euro. We expect<br />
currency rates to continue to be volatile.<br />
If currencies were to continue at approximately<br />
US Dollar 1.45/Euro 1.30 relative to Sterling<br />
and assuming a constant mix of currency<br />
results, we would expect approximately 2%<br />
favourable currency translation impact on<br />
revenue and profit due to currency translation<br />
in <strong>2016</strong>/17 compared with 2015/16. The<br />
positive impact would be greater in the first<br />
half of <strong>2016</strong>/17 than the second half.<br />
INCREASED FINANCING COST<br />
The net financing cost in the Income<br />
Statement of £7.1m was higher than the<br />
prior year (2015: £4.9m). The average cost<br />
of financing was higher than 2015 due to<br />
the increased interest rate on long-term<br />
borrowing and the higher levels of average<br />
debt for the year, following acquisitions<br />
made in the second half of the year (see<br />
the ‘Average debt and interest rates’<br />
table on page 45 for more information).<br />
Interest cover (EBITDA as a multiple of net<br />
interest expense as defined by our revolving<br />
credit facility) was 46 times (2015: 51 times)<br />
which was well in excess of the four times<br />
minimum required in our banking covenants.<br />
The net pension financing charge is included<br />
within the net financing cost. This year it<br />
increased to £2.0m (2015: £1.4m) because<br />
the net pension deficit at the start of the<br />
year, on which the interest cost is based,<br />
was above the deficit at the corresponding<br />
date in the prior year.<br />
LOWER GROUP TAX RATE<br />
The Group’s approach to tax is to ensure<br />
compliance with the tax regulations in all of<br />
the countries in which it operates. The key<br />
features of this are: (1) Tax compliance –<br />
<strong>Halma</strong> is committed to maintaining good<br />
relationships with tax authorities based on<br />
cooperation, transparency and paying in<br />
full the tax due in each jurisdiction; (2) Tax<br />
strategy – our tax arrangements have an<br />
underlying business purpose and, where<br />
possible, we consider mitigating tax in<br />
compliance with local legislation; and (3) Tax<br />
policy – the Board of Directors is regularly<br />
updated, either directly or through the Audit<br />
Committee, on the Group’s Tax policy and<br />
management of tax risks.<br />
The Group has major operating subsidiaries<br />
in 10 countries so the Group’s effective<br />
tax rate is a blend of these national tax<br />
rates applied to locally generated profits.<br />
A significant proportion (approximately one<br />
quarter) of Group profit is generated and<br />
taxed in the UK. The Groups’ effective tax<br />
rate on adjusted profit reduced to 21.9%<br />
(2015: 23.2%). The UK corporation tax rate<br />
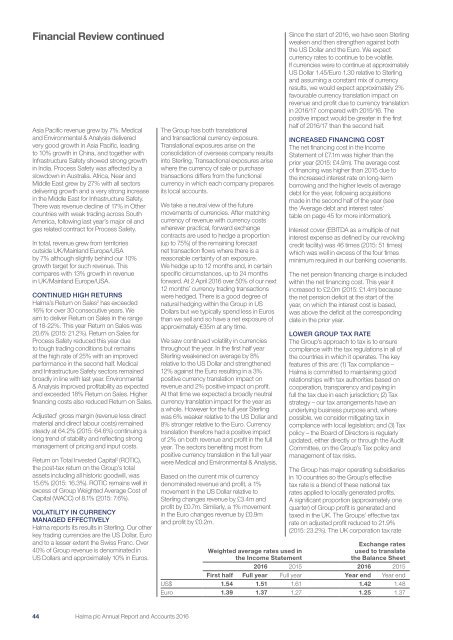
Exchange rates<br />
Weighted average rates used in<br />
the Income Statement<br />
used to translate<br />
the Balance Sheet<br />
<strong>2016</strong> 2015 <strong>2016</strong> 2015<br />
First half Full year Full year Year end Year end<br />
US$ 1.54 1.51 1.61 1.42 1.48<br />
Euro 1.39 1.37 1.27 1.25 1.37<br />
44 <strong>Halma</strong> plc Annual Report and Accounts <strong>2016</strong>