
Create successful ePaper yourself
Turn your PDF publications into a flip-book with our unique Google optimized e-Paper software.
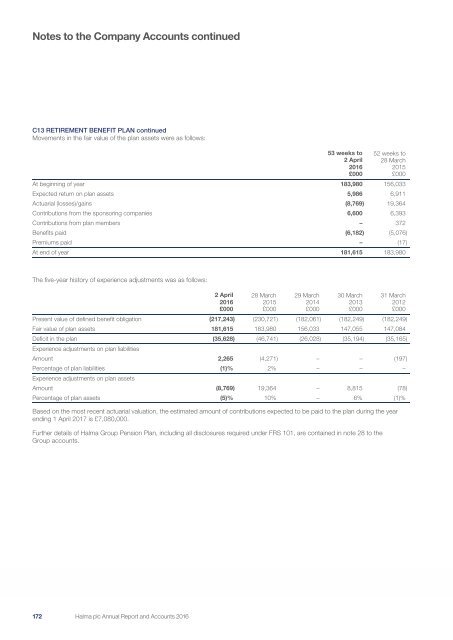
Notes to the Company Accounts continued<br />
C13 RETIREMENT BENEFIT PLAN continued<br />
Movements in the fair value of the plan assets were as follows:<br />
53 weeks to<br />
2 April<br />
<strong>2016</strong><br />
£000<br />
52 weeks to<br />
28 March<br />
2015<br />
£000<br />
At beginning of year 183,980 156,033<br />
Expected return on plan assets 5,986 6,911<br />
Actuarial (losses)/gains (8,769) 19,364<br />
Contributions from the sponsoring companies 6,600 6,393<br />
Contributions from plan members – 372<br />
Benefits paid (6,182) (5,076)<br />
Premiums paid – (17)<br />
At end of year 181,615 183,980<br />
The five-year history of experience adjustments was as follows:<br />
2 April<br />
<strong>2016</strong><br />
£000<br />
28 March<br />
2015<br />
£000<br />
29 March<br />
2014<br />
£000<br />
30 March<br />
2013<br />
£000<br />
Based on the most recent actuarial valuation, the estimated amount of contributions expected to be paid to the plan during the year<br />
ending 1 April 2017 is £7,080,000.<br />
Further details of <strong>Halma</strong> Group Pension Plan, including all disclosures required under FRS 101, are contained in note 28 to the<br />
Group accounts.<br />
31 March<br />
2012<br />
£000<br />
Present value of defined benefit obligation (217,243) (230,721) (182,061) (182,249) (182,249)<br />
Fair value of plan assets 181,615 183,980 156,033 147,055 147,084<br />
Deficit in the plan (35,628) (46,741) (26,028) (35,194) (35,165)<br />
Experience adjustments on plan liabilities<br />
Amount 2,265 (4,271) – – (197)<br />
Percentage of plan liabilities (1)% 2% – – –<br />
Experience adjustments on plan assets<br />
Amount (8,769) 19,364 – 8,815 (78)<br />
Percentage of plan assets (5)% 10% – 6% (1)%<br />
172 170<br />
<strong>Halma</strong> plc Annual Report and Accounts <strong>2016</strong>