
Create successful ePaper yourself
Turn your PDF publications into a flip-book with our unique Google optimized e-Paper software.
PERCENTAGE CHANGE IN CEO REMUNERATION<br />
The table below shows the percentage change in the CEO’s remuneration from the prior year compared to the average percentage change<br />
in remuneration for other employees. To provide a meaningful comparison, the analysis includes only salaried management employees and<br />
is based on a consistent set of employees.<br />
<strong>2016</strong> 2015<br />
CEO<br />
£000<br />
CEO<br />
£000<br />
CEO<br />
% change<br />
Other<br />
employees<br />
% change<br />
Salary 600 515 16.5% 6.8%<br />
Taxable benefits 31 27 14.8% –%<br />
Annual bonus 480 271 77.6% 20.3%<br />
RELATIVE IMPORTANCE OF SPEND ON PAY<br />
The table below shows the percentage change in total employee pay expenditure and shareholder distributions (i.e. dividends and share<br />
buybacks) from the financial year ended 28 March 2015 to the financial year ended 2 April <strong>2016</strong>.<br />
<strong>2016</strong><br />
£m<br />
2015<br />
£m % change<br />
Distribution to shareholders 48.5 45.3 7. 1%<br />
Employee remuneration (gross) 225.6 199.8 12.9%<br />
Employee remuneration (pro-rated) 225.6 210.1 7.4%<br />
The Directors are proposing a final dividend for the year ended 2 April <strong>2016</strong> of 7.83p per share (2015: 7.31p).<br />
STRATEGIC REPORT GOVERNANCE FINANCIAL STATEMENTS<br />
Pro-rated employee remuneration represents a restatement of the prior year employee remuneration for the current year number of employees.<br />
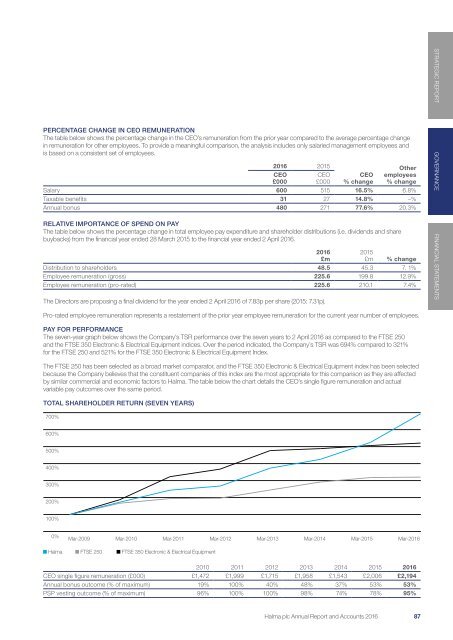
PAY FOR PERFORMANCE<br />
The seven-year graph below shows the Company’s TSR performance over the seven years to 2 April <strong>2016</strong> as compared to the FTSE 250<br />
and the FTSE 350 Electronic & Electrical Equipment indices. Over the period indicated, the Company’s TSR was 694% compared to 321%<br />
for the FTSE 250 and 521% for the FTSE 350 Electronic & Electrical Equipment Index.<br />
The FTSE 250 has been selected as a broad market comparator, and the FTSE 350 Electronic & Electrical Equipment index has been selected<br />
because the Company believes that the constituent companies of this index are the most appropriate for this comparison as they are affected<br />
by similar commercial and economic factors to <strong>Halma</strong>. The table below the chart details the CEO’s single figure remuneration and actual<br />
variable pay outcomes over the same period.<br />
800%<br />
TOTAL SHAREHOLDER RETURN (SEVEN YEARS)<br />
700%<br />
600%<br />
500%<br />
400%<br />
300%<br />
200%<br />
100%<br />
0%<br />
Mar-2009<br />
Mar-2010<br />
Mar-2011<br />
Mar-2012<br />
Mar-2013 Mar-2014 Mar-2015 Mar-<strong>2016</strong><br />
■ <strong>Halma</strong> ■ FTSE 250 ■ FTSE 350 Electronic & Electrical Equipment<br />
2010 2011 2012 2013 2014 2015 <strong>2016</strong><br />
CEO single figure remuneration (£000) £1,472 £1,999 £1,715 £1,958 £1,543 £2,006 £2,194<br />
Annual bonus outcome (% of maximum) 19% 100% 40% 48% 37% 53% 53%<br />
PSP vesting outcome (% of maximum) 96% 100% 100% 98% 74% 78% 95%<br />
<strong>Halma</strong> plc Annual Report and Accounts <strong>2016</strong> 87