
You also want an ePaper? Increase the reach of your titles
YUMPU automatically turns print PDFs into web optimized ePapers that Google loves.
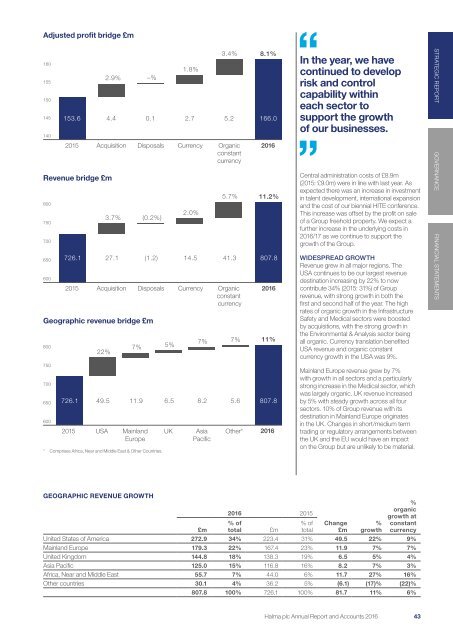
Adjusted profit bridge £m<br />
160<br />
155<br />
150<br />
145<br />
140<br />
153.6 4.4 0.1 2.7 5.2 166.0<br />
2015 Acquisition Disposals Currency Organic<br />
constant<br />
currency<br />
Revenue bridge £m<br />
800<br />
750<br />
700<br />
650<br />
600<br />
2.9% –%<br />
3.7% (0.2%)<br />
1.8%<br />
2015 Acquisition Disposals Currency Organic<br />
constant<br />
currency<br />
3.4% 8.1%<br />
<strong>2016</strong><br />
726.1 27.1 (1.2) 14.5 41.3 807.8<br />
Geographic revenue bridge £m<br />
800<br />
750<br />
700<br />
650<br />
600<br />
22%<br />
2015 USA Mainland<br />
Europe<br />
7% 5%<br />
UK<br />
2.0%<br />
Asia<br />
Pacific<br />
5.7% 11.2%<br />
<strong>2016</strong><br />
726.1 49.5 11.9 6.5 8.2 5.6 807.8<br />
* Comprises Africa, Near and Middle East & Other Countries.<br />
7% 7% 11%<br />
Other* <strong>2016</strong><br />
In the year, we have<br />
continued to develop<br />
risk and control<br />
capability within<br />
each sector to<br />
support the growth<br />
of our businesses.<br />
Central administration costs of £8.9m<br />
(2015: £9.0m) were in line with last year. As<br />
expected there was an increase in investment<br />
in talent development, international expansion<br />
and the cost of our biennial HITE conference.<br />
This increase was offset by the profit on sale<br />
of a Group freehold property. We expect a<br />
further increase in the underlying costs in<br />
<strong>2016</strong>/17 as we continue to support the<br />
growth of the Group.<br />
WIDESPREAD GROWTH<br />
Revenue grew in all major regions. The<br />
USA continues to be our largest revenue<br />
destination increasing by 22% to now<br />
contribute 34% (2015: 31%) of Group<br />
revenue, with strong growth in both the<br />
first and second half of the year. The high<br />
rates of organic growth in the Infrastructure<br />
Safety and Medical sectors were boosted<br />
by acquisitions, with the strong growth in<br />
the Environmental & Analysis sector being<br />
all organic. Currency translation benefited<br />
USA revenue and organic constant<br />
currency growth in the USA was 9%.<br />
Mainland Europe revenue grew by 7%<br />
with growth in all sectors and a particularly<br />
strong increase in the Medical sector, which<br />
was largely organic. UK revenue increased<br />
by 5% with steady growth across all four<br />
sectors. 10% of Group revenue with its<br />
destination in Mainland Europe originates<br />
in the UK. Changes in short/medium term<br />
trading or regulatory arrangements between<br />
the UK and the EU would have an impact<br />
on the Group but are unlikely to be material.<br />
STRATEGIC REPORT GOVERNANCE FINANCIAL STATEMENTS<br />
GEOGRAPHIC REVENUE GROWTH<br />
<strong>2016</strong> 2015<br />
% of<br />
total £m<br />
Change<br />
£m<br />
%<br />
growth<br />
%<br />
organic<br />
growth at<br />
constant<br />
currency<br />
£m<br />
United States of America 272.9 34% 223.4 31% 49.5 22% 9%<br />
Mainland Europe 179.3 22% 167.4 23% 11.9 7% 7%<br />
United Kingdom 144.8 18% 138.3 19% 6.5 5% 4%<br />
Asia Pacific 125.0 15% 116.8 16% 8.2 7% 3%<br />
Africa, Near and Middle East 55.7 7% 44.0 6% 11.7 27% 16%<br />
Other countries 30.1 4% 36.2 5% (6.1) (17)% (22)%<br />
807.8 100% 726.1 100% 81.7 11% 6%<br />
% of<br />
total<br />
<strong>Halma</strong> plc Annual Report and Accounts <strong>2016</strong> 43