You also want an ePaper? Increase the reach of your titles
YUMPU automatically turns print PDFs into web optimized ePapers that Google loves.
Financial Review<br />
Building on long-term<br />
achievement<br />
Through a combination of organic and acquisitive growth <strong>Halma</strong><br />
aims to deliver sustained long-term shareholder value. We have<br />
a long track record of growing dividends and of investment in our<br />
business. This year’s record results build on that achievement.<br />
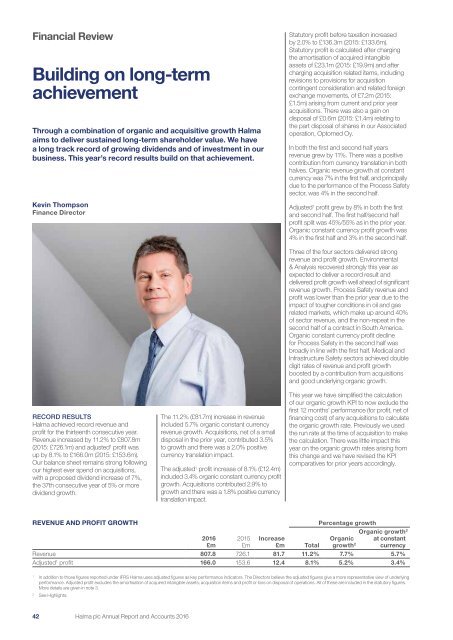
Kevin Thompson<br />
Finance Director<br />
Statutory profit before taxation increased<br />
by 2.0% to £136.3m (2015: £133.6m).<br />
Statutory profit is calculated after charging<br />
the amortisation of acquired intangible<br />
assets of £23.1m (2015: £19.9m) and after<br />
charging acquisition related items, including<br />
revisions to provisions for acquisition<br />
contingent consideration and related foreign<br />
exchange movements, of £7.2m (2015:<br />
£1.5m) arising from current and prior year<br />
acquisitions. There was also a gain on<br />
disposal of £0.6m (2015: £1.4m) relating to<br />
the part disposal of shares in our Associated<br />
operation, Optomed Oy.<br />
In both the first and second half years<br />
revenue grew by 11%. There was a positive<br />
contribution from currency translation in both<br />
halves. Organic revenue growth at constant<br />
currency was 7% in the first half, and principally<br />
due to the performance of the Process Safety<br />
sector, was 4% in the second half.<br />
Adjusted 1 profit grew by 8% in both the first<br />
and second half. The first half/second half<br />
profit split was 45%/55% as in the prior year.<br />
Organic constant currency profit growth was<br />
4% in the first half and 3% in the second half.<br />
RECORD RESULTS<br />
<strong>Halma</strong> achieved record revenue and<br />
profit for the thirteenth consecutive year.<br />
Revenue increased by 11.2% to £807.8m<br />
(2015: £726.1m) and adjusted 1 profit was<br />
up by 8.1% to £166.0m (2015: £153.6m).<br />
Our balance sheet remains strong following<br />
our highest ever spend on acquisitions,<br />
with a proposed dividend increase of 7%,<br />
the 37th consecutive year of 5% or more<br />
dividend growth.<br />
The 11.2% (£81.7m) increase in revenue<br />
included 5.7% organic constant currency<br />
revenue growth. Acquisitions, net of a small<br />
disposal in the prior year, contributed 3.5%<br />
to growth and there was a 2.0% positive<br />
currency translation impact.<br />
The adjusted 1 profit increase of 8.1% (£12.4m)<br />
included 3.4% organic constant currency profit<br />
growth. Acquisitions contributed 2.9% to<br />
growth and there was a 1.8% positive currency<br />
translation impact.<br />
Three of the four sectors delivered strong<br />
revenue and profit growth. Environmental<br />
& Analysis recovered strongly this year as<br />
expected to deliver a record result and<br />
delivered profit growth well ahead of significant<br />
revenue growth. Process Safety revenue and<br />
profit was lower than the prior year due to the<br />
impact of tougher conditions in oil and gas<br />
related markets, which make up around 40%<br />
of sector revenue, and the non-repeat in the<br />
second half of a contract in South America.<br />
Organic constant currency profit decline<br />
for Process Safety in the second half was<br />
broadly in line with the first half. Medical and<br />
Infrastructure Safety sectors achieved double<br />
digit rates of revenue and profit growth<br />
boosted by a contribution from acquisitions<br />
and good underlying organic growth.<br />
This year we have simplified the calculation<br />
of our organic growth KPI to now exclude the<br />
first 12 months’ performance (for profit, net of<br />
financing cost) of any acquisitions to calculate<br />
the organic growth rate. Previously we used<br />
the run rate at the time of acquisition to make<br />
the calculation. There was little impact this<br />
year on the organic growth rates arising from<br />
this change and we have revised the KPI<br />
comparatives for prior years accordingly.<br />
REVENUE AND PROFIT GROWTH<br />
<strong>2016</strong><br />
£m<br />
2015<br />
£m<br />
Increase<br />
£m Total<br />
Percentage growth<br />
Organic growth 2<br />
Organic at constant<br />
growth 2 currency<br />
Revenue 807.8 726.1 81.7 11.2% 7.7% 5.7%<br />
Adjusted 1 profit 166.0 153.6 12.4 8.1% 5.2% 3.4%<br />
1<br />
In addition to those figures reported under IFRS <strong>Halma</strong> uses adjusted figures as key performance indicators. The Directors believe the adjusted figures give a more representative view of underlying<br />
performance. Adjusted profit excludes the amortisation of acquired intangible assets; acquisition items and profit or loss on disposal of operations. All of these are included in the statutory figures.<br />
More details are given in note 3.<br />
2<br />
See Highlights.<br />
42 <strong>Halma</strong> plc Annual Report and Accounts <strong>2016</strong>


