
Create successful ePaper yourself
Turn your PDF publications into a flip-book with our unique Google optimized e-Paper software.
Remuneration Committee Report continued<br />
Annual Remuneration<br />
Report continued<br />
OTHER PAYMENTS<br />
No payments were made to former Directors after their retirement, nor were any payments made on cessation during the year under review.<br />
Neil Quinn was employed from the date he retired from the Board (14 May 2015) through 31 March <strong>2016</strong> and was paid salary of £220,000 for<br />
this period. He received benefits of £13,000 and vested share awards of £398,000. Mr Quinn’s unvested share awards will vest at the usual<br />
vesting dates subject to the performance targets being met and pro-rated for employment as a proportion of the total vesting period.<br />
INCENTIVE OUTCOMES FOR <strong>2016</strong><br />
Annual bonus in respect of <strong>2016</strong><br />
In <strong>2016</strong>, the maximum bonus opportunity for executive Directors was 125% to 150% of salary, solely linked to performance as measured by<br />
an Economic Value Added (EVA) calculation.<br />
For the CEO and FD (150% maximum), bonuses are calculated based on Group profit exceeding a target calculated from the profits for the<br />
three preceding financial years after charging cost of capital, including the cost of acquisitions. As the EVA for each year is utilised for a further<br />
three years in the comparator calculations, executives must consider the medium-term interests of the Group otherwise there is the potential<br />
for an adverse impact on their capacity to earn a bonus.<br />
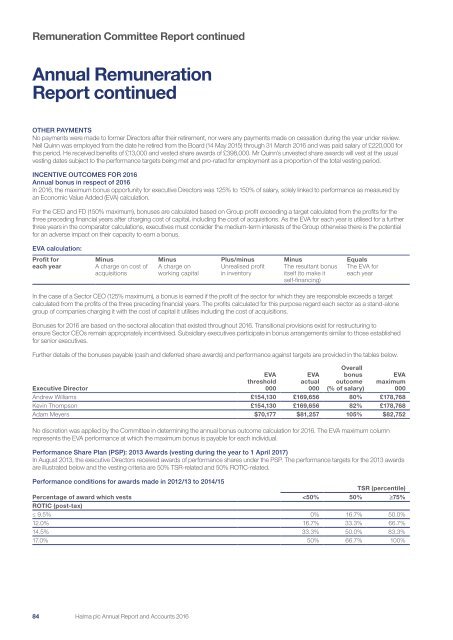
EVA calculation:<br />
Profit for<br />
each year<br />
Minus<br />
A charge on cost of<br />
acquisitions<br />
Minus<br />
A charge on<br />
working capital<br />
Plus/minus<br />
Unrealised profit<br />
in inventory<br />
Minus<br />
The resultant bonus<br />
itself (to make it<br />
self-financing)<br />
Equals<br />
The EVA for<br />
each year<br />
In the case of a Sector CEO (125% maximum), a bonus is earned if the profit of the sector for which they are responsible exceeds a target<br />
calculated from the profits of the three preceding financial years. The profits calculated for this purpose regard each sector as a stand-alone<br />
group of companies charging it with the cost of capital it utilises including the cost of acquisitions.<br />
Bonuses for <strong>2016</strong> are based on the sectoral allocation that existed throughout <strong>2016</strong>. Transitional provisions exist for restructuring to<br />
ensure Sector CEOs remain appropriately incentivised. Subsidiary executives participate in bonus arrangements similar to those established<br />
for senior executives.<br />
Further details of the bonuses payable (cash and deferred share awards) and performance against targets are provided in the tables below.<br />
Executive Director<br />
EVA<br />
threshold<br />
000<br />
EVA<br />
actual<br />
000<br />
Overall<br />
bonus<br />
outcome<br />
(% of salary)<br />
EVA<br />
maximum<br />
000<br />
Andrew Williams £154,130 £169,656 80% £178,768<br />
Kevin Thompson £154,130 £169,656 82% £178,768<br />
Adam Meyers $70,177 $81,257 105% $82,752<br />
No discretion was applied by the Committee in determining the annual bonus outcome calculation for <strong>2016</strong>. The EVA maximum column<br />
represents the EVA performance at which the maximum bonus is payable for each individual.<br />
Performance Share Plan (PSP): 2013 Awards (vesting during the year to 1 April 2017)<br />
In August 2013, the executive Directors received awards of performance shares under the PSP. The performance targets for the 2013 awards<br />
are illustrated below and the vesting criteria are 50% TSR-related and 50% ROTIC-related.<br />
Performance conditions for awards made in 2012/13 to 2014/15<br />
TSR (percentile)<br />
Percentage of award which vests<br />