
You also want an ePaper? Increase the reach of your titles
YUMPU automatically turns print PDFs into web optimized ePapers that Google loves.
fell from 21% to 20% this year, and we<br />
benefited from an increase in widely claimed<br />
R&D related tax incentives, exemptions<br />
and reliefs (for example under the UK<br />
‘Patent Box’ rules).<br />
STRONG CASH GENERATION<br />
Cash generation is an important component<br />
of the <strong>Halma</strong> model underpinning further<br />
investment in our businesses, supporting<br />
value enhancing acquisitions and funding an<br />
increasing dividend. Our cash performance<br />
in 2015/16 was strong. Adjusted operating<br />
cash flow was £148.3m (2015: £138.7m)<br />
and represented 86% (2015: 87%) of<br />
adjusted operating profit, ahead of our<br />
cash conversion KPI target of 85%.<br />
A summary of the year’s cash flow is shown<br />
in the table on page 46. The largest outflows<br />
in the year were in relation to our record<br />
spend on acquisitions, dividends and taxation<br />
paid. Working capital outflow, comprising<br />
changes in inventory, receivables and<br />
creditors, totalled £5.8m (2015: £6.0m) and<br />
reflected strong control of operations at local<br />
company level.<br />
Dividends totalling £46.5m (2015: £43.4m)<br />
were paid to shareholders in the year.<br />
Taxation paid was £27.2m (2015: £30.8m).<br />
CAPITAL ALLOCATION AND FUNDING<br />
<strong>Halma</strong> aims to deliver high returns, measured<br />
by Return on Total Invested Capital (ROTIC),<br />
well in excess of our cost of capital. Future<br />
earnings growth and strong cash returns<br />
underpin ROTIC and our capital allocation<br />
as follows:<br />
• Investment for organic growth<br />
Organic growth is our priority and is driven<br />
by investment in our businesses, in particular<br />
through capital expenditure, innovation of<br />
new products, international expansion and<br />
the development of our people.<br />
• Regular and increasing returns<br />
to shareholders<br />
We have maintained a long-term progressive<br />
dividend policy as our preferred route for<br />
delivering cash returns to shareholders.<br />
• Value enhancing acquisitions<br />
We supplement organic growth with<br />
acquisitions in related markets at sensible<br />
prices. This brings new technology and<br />
Intellectual Property into the Group and<br />
can expand our market reach.<br />
The above investment and shareholder<br />
returns are funded by strong cash flow and<br />
moderate levels of debt appropriate to our<br />
needs. Ensuring we have sufficient financial<br />
capacity is important to our model.<br />
INVESTMENT FOR ORGANIC GROWTH<br />
All sectors continue to innovate and invest<br />
in new products with R&D spend controlled<br />
by each individual <strong>Halma</strong> company. This<br />
year R&D expenditure grew by 19% with<br />
increased investment through the year,<br />
in particular in the Medical sector. R&D<br />
expenditure as a percentage of revenue<br />
increased to 5.1% (2015: 4.8%). There is a<br />
good pipeline of new products and the<br />
increased investment by our businesses<br />
reflects their strategy to expand their range of<br />
products to drive growth. In the medium-term<br />
we expect R&D expenditure to increase<br />
broadly in line with revenue.<br />
Under IFRS accounting rules we are required<br />
to capitalise certain development projects<br />
and amortise the cost over an appropriate<br />
period, which we determine as three years.<br />
In 2015/16 we capitalised/reclassified<br />
£8.6m (2015: £7.4m), acquired £3.6m, and<br />
amortised/disposed of £5.3m (2015: £5.6m).<br />
This results in an asset carried on the<br />
Consolidated Balance Sheet, after<br />
£0.7m of foreign exchange movements,<br />
of £23.5m (2015: £15.9m). All R&D<br />
projects and particularly those requiring<br />
capitalisation, are subject to rigorous<br />
review and approval processes.<br />
Capital expenditure on property, plant and<br />
computer software this year was £24.1m<br />
(2015: £23.2m). This maintains investment<br />
in our operating capability and includes<br />
investment of £4m in a property in our<br />
Medical sector (2015: £5m).<br />
REGULAR AND INCREASING<br />
RETURNS FOR SHAREHOLDERS<br />
Adjusted 1 earnings per share increased by<br />
10% to 34.26p (2015: 31.17p) ahead of the<br />
increase in adjusted 1 profit, primarily due to<br />
the lower tax rate. Statutory earnings per<br />
share increased by 5% to 28.76p (2015:<br />
27.49p) due to the lower tax rate and the<br />
factors noted previously affecting the<br />
calculation of statutory profit. We deliver<br />
shareholder value via consistent growth in<br />
earnings per share and this is reflected in our<br />
senior management share based incentives.<br />
The Board is recommending a 7.1% increase<br />
in the final dividend to 7.83p per share (2015:<br />
7.31p per share), which together with the<br />
4.98p per share interim dividend, gives a total<br />
dividend of 12.81p (2015: 11.96p), up 7.1%.<br />
The final dividend for 2015/16 is subject to<br />
approval by shareholders at the AGM on<br />
21 July <strong>2016</strong> and will be paid on 17 August<br />
<strong>2016</strong> to shareholders on the register at<br />
15 July <strong>2016</strong>. With this latest rise, <strong>Halma</strong><br />
will have increased its dividend by 5%<br />
or more for 37 consecutive years.<br />
Our long-term progressive dividend policy<br />
balances dividend increases with the<br />
medium-term rates of organic profit growth<br />
achieved, taking into account potential<br />
acquisition spend and maintaining moderate<br />
debt levels. Our policy is to maintain dividend<br />
cover (the ratio of adjusted profit after tax to<br />
dividends paid and proposed) above two<br />
times and this year dividend cover is 2.67<br />
times (2015: 2.61 times). We continue to<br />
determine the dividend payout each year<br />
based on all of the factors noted above.<br />
VALUE ENHANCING ACQUISITIONS<br />
Acquisitions and disposals are an important<br />
part of our growth strategy. We buy<br />
businesses already successful in, or adjacent<br />
to, the niches in which we operate. Sector<br />
acquisition resources to support this strategy<br />
continue to be increased.<br />
In the year we spent £193m on four<br />
acquisitions (net of cash/(debt) acquired<br />
of £2m). In addition we paid £10m in<br />
contingent consideration and settlement<br />
of loan notes for acquisitions made in<br />
prior years, giving a total spend of £203m.<br />
The acquisitions made in 2015/16 were<br />
as follows:<br />
Value Added Solutions, LLC (VAS) was<br />
acquired in May 2015. VAS has been<br />
integrated with one of our Medical sector<br />
companies, Diba Industries, which is also<br />
based in Connecticut, USA. The initial cash<br />
consideration was US$5m (£3m).<br />
Firetrace USA, LLC was acquired in October<br />
2015 and is based near Phoenix, Arizona.<br />
The initial consideration was US$110m (£73m).<br />
Visiometrics, S.L., located outside<br />
Barcelona, Spain and Visual Performance<br />
Diagnostics, Inc., located in Aliso Viejo,<br />
California, USA (together referred to as<br />
Visiometrics) were acquired in December<br />
2015, joining our Medical sector. The cash<br />
consideration comprises three elements:<br />
€18m (£13m) paid at closing; deferred<br />
contingent consideration up to €69m (£50m)<br />
paid based on the profit performance of<br />
Visiometrics over the next three years;<br />
and deferred contingent consideration up to<br />
€40m (£29m) paid in royalties over the next<br />
five years with a maximum total consideration<br />
of €125m (£91m). Our current estimate is<br />
that €30m (£22m) will be paid in deferred<br />
contingent consideration and this has been<br />
accrued in these accounts.<br />
CenTrak, Inc., based in Newtown,<br />
Pennsylvania, USA was acquired in February<br />
<strong>2016</strong> and also joins the Medical sector. The<br />
cash consideration was US$140m (£97m).<br />
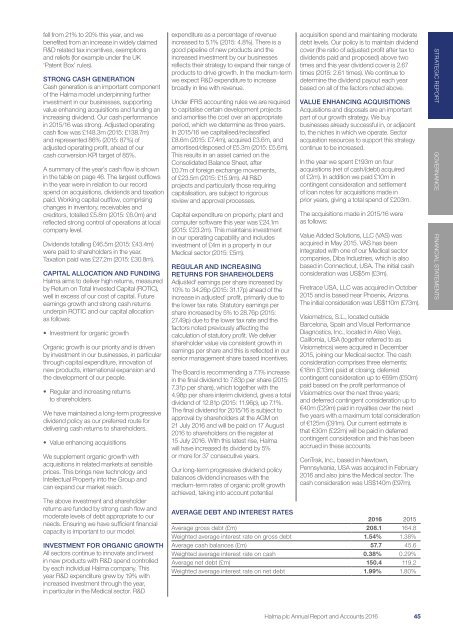
AVERAGE DEBT AND INTEREST RATES<br />
<strong>2016</strong> 2015<br />
Average gross debt (£m) 208.1 164.8<br />
Weighted average interest rate on gross debt 1.54% 1.38%<br />
Average cash balances (£m) 57.7 45.6<br />
Weighted average interest rate on cash 0.38% 0.29%<br />
Average net debt (£m) 150.4 119.2<br />
Weighted average interest rate on net debt 1.99% 1.80%<br />
STRATEGIC REPORT GOVERNANCE FINANCIAL STATEMENTS<br />
<strong>Halma</strong> plc Annual Report and Accounts <strong>2016</strong> 45