Sullivan Microsite DigiSample

Create successful ePaper yourself
Turn your PDF publications into a flip-book with our unique Google optimized e-Paper software.
<strong>Sullivan</strong> AP˙<strong>Sullivan</strong>˙Chapter01 October 8, 2016 17:4<br />
<strong>Sullivan</strong><br />
88 82 Chapter 1 • Limits and Continuity<br />
AP® Exam Tip<br />
It is helpful to be familiar with limits of<br />
ax<br />
the form lim sin( ) before taking the<br />
x→0<br />
exam.<br />
x<br />
ax<br />
lim sin( ) = a<br />
x→0<br />
x<br />
Consider working with variations of this<br />
problem as well, such as<br />
ax a<br />
lim sin( ) =<br />
x→0<br />
bx b<br />
These limits can be found using the<br />
Squeeze Theorem, but familiarity will<br />
save time during the exam.<br />
On completion of Section 4.5, the<br />
student will be able to solve problems<br />
of this form using L’Hôpital’s Rule, but<br />
in the meantime, students may prefer<br />
to rely on these two forms rather than<br />
finding these limits using the Squeeze<br />
Theorem.<br />
AP® CaLC skill builder<br />
for example 4<br />
Investigating a Limit Using a Table and<br />
Technology<br />
x<br />
Investigate lim sin(5 ) using a table.<br />
x→0<br />
x<br />
Solution<br />
sin(5 x)<br />
The domain of the function fx ( ) =<br />
x<br />
is {x | x ≠ 0}. So f is defined everywhere<br />
on the open interval containing 0, except<br />
at 0. We create a table by evaluating the<br />
function at values of x near 0, choosing<br />
values that are slightly less than 0 and<br />
slightly greater than 0.<br />
2x 2 if x < 1<br />
33. f (x) =<br />
3x 2 at c = 1<br />
53. Slope<br />
e x of<br />
−<br />
a<br />
1<br />
Tangent Line For<br />
e x −<br />
f (x)<br />
1<br />
Table 2 suggests that lim = 1 and lim = 1.<br />
1 − 1 if x > 1<br />
2 x2 − 1:<br />
x→0<br />
− x<br />
x→0 + x<br />
x 3 if x < −1<br />
e x − 1 (a) Find the slope m sec of the secant line containing the<br />
34. f (x) =<br />
x 2 at c =−1 This suggests lim = 1. points ■<br />
− 1 if x > −1<br />
x→0<br />
P = (2, f (2)) and Q = (2 + h, f (2 + h)).<br />
x<br />
(b) Use the result from (a) to complete the following table:<br />
x 2 if x ≤ 0<br />
NOW WORK Problem 13 and AP® Practice Problem 6.<br />
35. f (x) =<br />
at c = 0<br />
2x + 1 if x > 0<br />
⎧<br />
h −0.5 −0.1 −0.001 0.001 0.1 0.5<br />
⎨ x 2 if x < 1<br />
m sec<br />
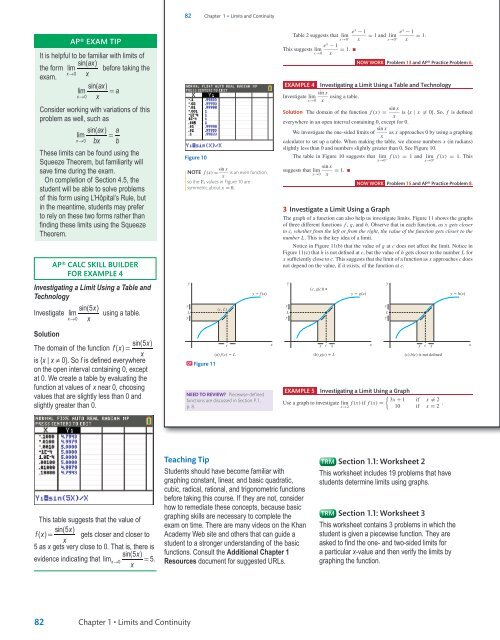
36. f (x) = 2 if x = 1 at c = 1 EXAMPLE 4 Investigating a Limit Using a Table and Technology<br />
⎩<br />
−3x + 2 if x > 1<br />
sin x (c) Investigate the limit of the slope of the secant line found in (a)<br />
Investigate lim using a table.<br />
x→0 x<br />
as h → 0.<br />
(d) What is the slope of the tangent line to the graph of f at the<br />
Applications and Extensions<br />
Solution The domain of the function point P = f (x) (2, f = (2))?<br />
sin x is {x | x = 0}. So, f is defined<br />
In Problems 37–40, sketch a graph of a function with the given<br />
x<br />
(e) On the same set of axes, graph f and the tangent line to f at<br />
properties. Answers will vary.<br />
everywhere in an open interval containing 0, except for 0.<br />
P = (2, f (2)).<br />
37. lim f (x) = 3; lim f (x) = 3; lim f (x) = 1;<br />
x→2 x→3− x→3 + We investigate the one-sided limits of sin x as x approaches 0 by using a graphing<br />
f (2) = 3; f (3) = 1<br />
54. Slope of a Tangent<br />
x<br />
Line For f (x) = x 2 − 1:<br />
calculator to set up a table. When making the table, we choose numbers x (in radians)<br />
38. lim f (x) = 0; lim f (x) =−2; lim slightly f (x) =−2; less than 0 and numbers (a) Find slightly the slope greater m sec than of the 0. secant See Figure line containing 10. the<br />
x→−1 x→2− x→2 +<br />
points P = (−1, f (−1)) and Q = (−1 + h, f (−1 + h)).<br />
Figure f (−1) 10<br />
The table in Figure 10 suggests that lim f (x) = 1 and lim f (x) = 1. This<br />
is not defined; f (2) =−2<br />
x→0 −<br />
x→0 +<br />
39. lim f (x) = 4; lim f (x) =−1; lim<br />
(b) Use the result from (a) to complete the following table:<br />
f (x) = 0; sin x<br />
x→1 x→0− x→0 + suggests that lim = 1. ■<br />
NOTE f (x) = sin x is an even function,<br />
f (0) =−1;<br />
x<br />
x→0 x<br />
f (1) = 2<br />
h −0.1 −0.01 −0.001 −0.0001 0.0001 0.001 0.01 0.1<br />
so the Y 1 values in Figure 10 are<br />
40. lim f (x) = 2; lim f (x) = 0; lim f (x) = 1;<br />
m sec<br />
NOW WORK Problem 15 and AP® Practice Problem 8.<br />
symmetric x→2<br />
about x = 0.<br />
x→−1 x→1<br />
f (−1) = 1; f (2) = 3<br />
(c) Investigate the limit of the slope of the secant line found<br />
in (a) as h → 0.<br />
In Problems 41–50, use either a graph or a table to 3investigate<br />
Investigate a Limit (d) Using What isa the Graph slope of the tangent line to the graph of f at the<br />
each limit.<br />
The graph of a function can alsopoint helpP us = investigate (−1, f (−1))? limits. Figure 11 shows the graphs<br />
|x − 5|<br />
|x − 5|<br />
41. lim<br />
42. lim<br />
43. of three lim<br />
x→5 + x − 5<br />
x→5 − x − 5<br />
<br />
different<br />
x→ 12<br />
2x functions (e) f , g, Onand theh. same Observe set of axes, that in graph eachf function, and the tangent as x line getstocloser<br />
f<br />
−<br />
to c, whether from the left or from at P the = (−1, right, f the (−1)). value of the function gets closer to the<br />
number L. This is the key idea of a limit.<br />
PAGE<br />
44. lim <br />
x→ 12<br />
2x 45. lim<br />
+ <br />
x→ 23<br />
2x 46. lim<br />
− <br />
x→ 23<br />
2x<br />
+<br />
85 55. (a) Investigate lim cos π by using a table and evaluating the<br />
Notice in Figure 11(b) that the value x→0 of g atxc does not affect the limit. Notice in<br />
<br />
Figure 11(c) that h is not defined function at c, but f (x) the= value cos π of<br />
47. lim |x|−x 48. lim |x|−x<br />
x at h gets closer to the number L for<br />
x sufficiently close to c. This suggests<br />
x→2 + x→2 −<br />
x =− 1 that<br />
3 3 2 , − 1 the limit<br />
4 , − 1 of<br />
8 , − 1 a function<br />
10 , − 1 as<br />
12 ,..., 1 x approaches<br />
12 , 1 10 , 1 8 , 1 4 , 1 c does<br />
not depend on the value, if it exists, of the function at c.<br />
2 .<br />
49. lim x−x 50. lim x−x<br />
x→2 + x→2 −<br />
51. Slope of a Tangent Line For f (x) = 3x 2 (b) Investigate lim cos π y<br />
by using a table and evaluating the<br />
:<br />
y<br />
y x→0 x<br />
(c, g(c))<br />
(a) Find the slope of the secant y 5 line f (x) containing the points (2, 12)<br />
y function 5 g(x) f (x) = cos π x at<br />
y 5 h(x)<br />
and (3, 27).<br />
y<br />
y<br />
(b) Find the slope of the secant line containing the points (2, 12)<br />
x =−1, − 1 3 , − 1 y<br />
5 , − 1 7 , − 1 9 ,..., 1 9 , 1 7 , 1 5 , 1 (c, L)<br />
3 , 1.<br />
L<br />
L<br />
L<br />
and (x, f (x)), x = 2.<br />
y<br />
y<br />
(c) Compare the results y from (a) and (b). What do you conclude<br />
(c) Create a table to investigate the slope of the tangent line to the<br />
about the limit? Why do you think this happens? What is<br />
graph of f at 2 using the result from (b).<br />
your view about using a table to draw a conclusion about<br />
(d) On the same set of axes, graph f , the tangent line to the graph<br />
limits?<br />
of f at the point (2, 12), and the secant line from (a).<br />
c<br />
x<br />
(d) Use technology to graph f . Begin with the x-window<br />
52. Slope of a Tangent Line For f (x) = x 3 x c x<br />
x<br />
x c x<br />
x<br />
:<br />
[−2π, 2π] and the y-window [−1, 1]. If you were finding<br />
(a) f (c) 5 L (b) g(c) Þ L (c) h(c) is not defined<br />
(a) Find the slope of the secant line containing the points (2, 8)<br />
lim f (x) using a graph, what would you conclude? Zoom in<br />
x→0<br />
DF Figure and 11 (3, 27).<br />
on the graph. Describe what you see. (Hint: Be sure your<br />
(b) Find the slope of the secant line containing the points (2, 8)<br />
calculator is set to the radian mode.)<br />
and (x, f (x)), x = 2.<br />
56. (a) Investigate lim cos π by using a table and evaluating the<br />
(c) Create a table to investigate the slope of the tangent line to the<br />
x→0 x2 graph of f at 2 using the result from (b). EXAMPLE 5 Investigatingfunction a Limit f (x) Using = cos a Graph<br />
NEED TO REVIEW? Piecewise-defined<br />
{ π at x =−0.1, −0.01, −0.001,<br />
(d) On the same set of axes, graph f , the tangent line to the graph<br />
x2 functions are discussed in Section P.1,<br />
3x + 1 if x = 2<br />
p. 8. of f at the point (2, 8), and the secant line<br />
Use<br />
from<br />
a graph<br />
(a).<br />
to investigate lim f<br />
x→2 −0.0001, (x) if f (x) 0.0001, = 0.001, 10 0.01, 0.1. if x = 2 .<br />
This table suggests that the value of<br />
sin(5 x)<br />
fx ( ) = gets closer and closer to<br />
x<br />
5 as x gets very close to 0. That is, there is<br />
sin(5 x)<br />
evidence indicating that limx→0<br />
= 5.<br />
x<br />
Teaching Tip<br />
Students should have become familiar with<br />
graphing constant, linear, and basic quadratic,<br />
cubic, radical, rational, and trigonometric functions<br />
before taking this course. If they are not, consider<br />
how to remediate these concepts, because basic<br />
graphing skills are necessary to complete the<br />
exam on time. There are many videos on the Khan<br />
Academy Web site and others that can guide a<br />
student to a stronger understanding of the basic<br />
functions. Consult the Additional Chapter 1<br />
Resources document for suggested URLs.<br />
TRM Section 1.1: Worksheet 2<br />
This worksheet includes 19 problems that have<br />
students determine limits using graphs.<br />
TRM Section 1.1: Worksheet 3<br />
This worksheet contains 3 problems in which the<br />
student is given a piecewise function. They are<br />
asked to find the one- and two-sided limits for<br />
a particular x-value and then verify the limits by<br />
graphing the function.<br />
82<br />
Chapter 1 • Limits and Continuity<br />
TE_<strong>Sullivan</strong>_Chapter01_PART 0.indd 11<br />
11/01/17 9:51 am