Sullivan Microsite DigiSample

You also want an ePaper? Increase the reach of your titles
YUMPU automatically turns print PDFs into web optimized ePapers that Google loves.
<strong>Sullivan</strong> AP˙<strong>Sullivan</strong>˙Chapter01 October 8, 2016 17:4<br />
<strong>Sullivan</strong><br />
104 Chapter 1 • Limits and Continuity<br />
AP® CaLC skill builder<br />
for example 2<br />
Determining Whether a Function Is<br />
Continuous at a Number<br />
3<br />
x −25x<br />
Determine whether f( x)<br />
= is<br />
2<br />
continuous at x = 5. x −5x<br />
Solution<br />
We first check the conditions for continuity.<br />
To determine if 5 is in the domain of f,<br />
compute<br />
3<br />
5 −25(5)<br />
f (5) =<br />
2<br />
5 −5(5)<br />
This shows that f (5) is not defined,<br />
because both numerator and denominator<br />
are 0. Since 5 is not in the domain of f,<br />
then f is not continuous at 5.<br />
AP® CaLC skill builder<br />
for example 2<br />
Determining Whether a Function Is<br />
Continuous at a Number<br />
4<br />
( x −1)<br />
Use the graph of f( x)<br />
= to<br />
1−<br />
x<br />
determine whether f is continuous at<br />
x = 1. If f is discontinuous, what type of<br />
discontinuity does the function have?<br />
y<br />
y<br />
4<br />
2<br />
x<br />
f(x) 2 2<br />
x 2 4<br />
4 2 2 4<br />
2<br />
(0, <br />
4 )<br />
2<br />
4<br />
Figure 23 f is continuous at 0;<br />
f is discontinuous at −2 and 2.<br />
x<br />
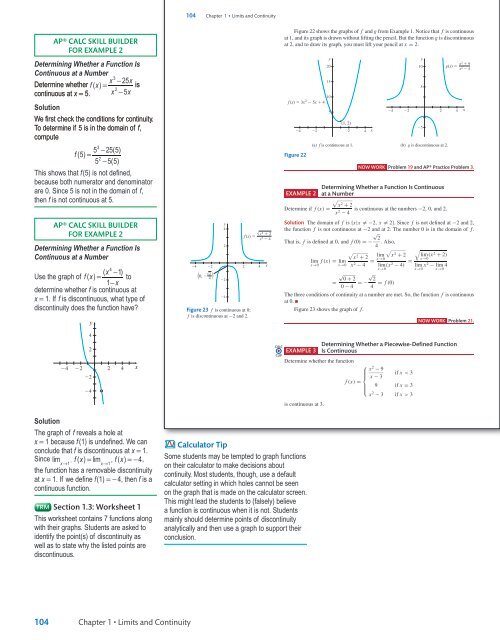
Figure 22 shows the graphs of f and g from Example 1. Notice that f is continuous<br />
at 1, and its graph is drawn without lifting the pencil. But the function g is discontinuous<br />
at 2, and to draw its graph, you must lift your pencil at x = 2.<br />
10<br />
f (x) 3x 2 5x 4<br />
4<br />
Figure 22<br />
2<br />
y<br />
20<br />
15<br />
5<br />
(1, 2)<br />
2<br />
4<br />
x<br />
(a) f is continuous at 1. (b) g is discontinuous at 2.<br />
4<br />
2<br />
y<br />
10<br />
5<br />
5<br />
2<br />
g(x) x2 9<br />
x 2 4<br />
NOW WORK Problem 19 and AP® Practice Problem 3.<br />
Determining Whether a Function Is Continuous<br />
EXAMPLE 2 at a Number<br />
<br />
x<br />
2<br />
+ 2<br />
Determine if f (x) = is continuous at the numbers −2, 0, and 2.<br />
x 2 − 4<br />
Solution The domain of f is {x|x = −2, x = 2}. Since f is not defined at −2 and 2,<br />
the function f is not continuous at −2 and at 2. The number 0 is in the domain of f.<br />
√<br />
2<br />
That is, f is defined at 0, and f (0) =−<br />
4 . Also,<br />
<br />
x<br />
2<br />
+ 2<br />
lim f (x) = lim<br />
x→0 x→0 x 2 − 4<br />
<br />
lim x 2<br />
+ 2 lim<br />
= x→0<br />
lim (x 2 − 4) = lim<br />
x→0<br />
x→0<br />
(x 2 + 2)<br />
x→0 x 2 − lim<br />
x→0<br />
4<br />
√ √<br />
0 + 2 2<br />
=<br />
0 − 4 =− 4 = f (0)<br />
The three conditions of continuity at a number are met. So, the function f is continuous<br />
at 0. ■<br />
Figure 23 shows the graph of f.<br />
NOW WORK Problem 21.<br />
4<br />
x<br />
4<br />
24<br />
2<br />
22<br />
22<br />
24<br />
2<br />
4<br />
x<br />
CALC<br />
CLIP<br />
EXAMPLE 3<br />
Determining Whether a Piecewise-Defined Function<br />
Is Continuous<br />
Determine whether the function<br />
⎧<br />
x 2 − 9<br />
if x < 3<br />
⎪⎨ x − 3<br />
f (x) =<br />
9 if x = 3<br />
⎪⎩<br />
x 2 − 3 if x > 3<br />
is continuous at 3.<br />
Solution<br />
The graph of f reveals a hole at<br />
x = 1 because f (1) is undefined. We can<br />
conclude that f is discontinuous at x = 1.<br />
Since lim − fx ( ) = lim + fx ( ) =−4,<br />
x→1 x→1<br />
the function has a removable discontinuity<br />
at x = 1. If we define f (1) = − 4, then f is a<br />
continuous function.<br />
TRM Section 1.3: Worksheet 1<br />
This worksheet contains 7 functions along<br />
with their graphs. Students are asked to<br />
identify the point(s) of discontinuity as<br />
well as to state why the listed points are<br />
discontinuous.<br />
Calculator Tip<br />
Some students may be tempted to graph functions<br />
on their calculator to make decisions about<br />
continuity. Most students, though, use a default<br />
calculator setting in which holes cannot be seen<br />
on the graph that is made on the calculator screen.<br />
This might lead the students to (falsely) believe<br />
a function is continuous when it is not. Students<br />
mainly should determine points of discontinuity<br />
analytically and then use a graph to support their<br />
conclusion.<br />
104<br />
Chapter 1 • Limits and Continuity<br />
TE_<strong>Sullivan</strong>_Chapter01_PART I.indd 1<br />
11/01/17 9:57 am