Sullivan Microsite DigiSample

Create successful ePaper yourself
Turn your PDF publications into a flip-book with our unique Google optimized e-Paper software.
<strong>Sullivan</strong> AP˙<strong>Sullivan</strong>˙Chapter01 October 8, 2016 17:4<br />
<strong>Sullivan</strong> <strong>Sullivan</strong>AP<br />
88 84 Chapter 1 • Limits and Continuity<br />
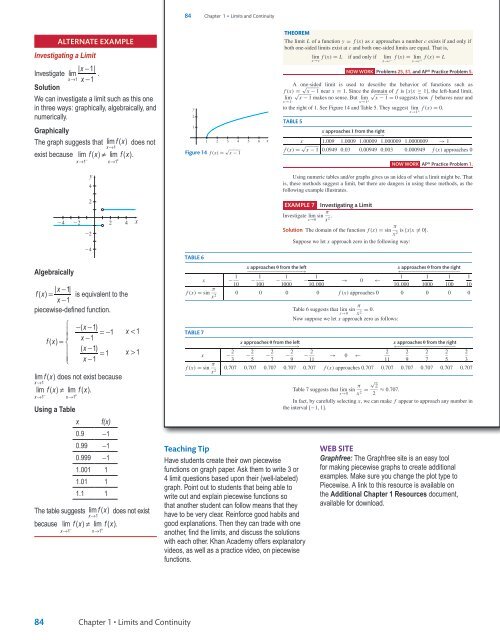
Alternate Example<br />
Investigating a Limit<br />
x<br />
Investigate lim | − 1| .<br />
x→1<br />
x −1<br />
Solution<br />
We can investigate a limit such as this one<br />
in three ways: graphically, algebraically, and<br />
numerically.<br />
Graphically<br />
The graph suggests that lim fx ( ) does not<br />
x→1<br />
exist because lim fx ( ) ≠ lim fx ( ).<br />
24<br />
Algebraically<br />
− +<br />
x→1 x→1<br />
22<br />
y<br />
4<br />
2<br />
22<br />
24<br />
| x −1|<br />
fx ( ) = is equivalent to the<br />
x −1<br />
piecewise-defined function.<br />
⎧ −( x −1)<br />
=−1<br />
x < 1<br />
⎪<br />
fx ( ) =<br />
x −1<br />
⎨<br />
⎪ ( x −1)<br />
− = 1 x > 1<br />
⎩<br />
⎪ x 1<br />
lim fx ( ) does not exist because<br />
x→1<br />
lim fx ( ) ≠ lim fx ( ).<br />
− +<br />
x→1 x→1<br />
Using a Table<br />
x f(x)<br />
0.9 −1<br />
0.99 −1<br />
0.999 −1<br />
1.001 1<br />
1.01 1<br />
1.1 1<br />
The table suggests lim fx ( ) does not exist<br />
x→1<br />
because lim fx ( ) ≠ lim fx ( ).<br />
− +<br />
x→1 x→1<br />
2<br />
4<br />
x<br />
2x 2 if x < 1<br />
33. f (x) =<br />
3x 2 at c = 1 THEOREM 53. Slope of a Tangent Line For f (x) = 1<br />
− 1 if x > 1<br />
2 x2 − 1:<br />
The limit L of a function y = f (x) as x approaches a number c exists if and only if<br />
x 3 (a) Find the slope m<br />
if x < −1<br />
sec of the secant line containing the<br />
both one-sided limits exist at c and both one-sided limits are equal. That is,<br />
34. f (x) =<br />
x 2 at c =−1<br />
points P = (2, f (2)) and Q = (2 + h, f (2 + h)).<br />
− 1 if x > −1<br />
lim f (x) = L(b) ifUse andthe only result if from lim(a) f to (x) complete = limthe following x 2 x→c table:<br />
x→c<br />
if x ≤ 0<br />
x→c +<br />
35. f (x) =<br />
at c = 0<br />
2x + 1 if x > 0<br />
NOW<br />
⎧<br />
h WORK −0.5Problems −0.1 25, −0.001 31, and AP® 0.001 Practice 0.1 Problem 0.5 5.<br />
⎨ x 2 if x < 1<br />
m sec<br />
36. f (x) = 2 if x = 1 at c = 1 A one-sided limit is used to describe the behavior of functions such as<br />
⎩<br />
−3x + 2 if x > 1<br />
f (x) = √ √ x − 1 near x = (c) 1. Since Investigate the √domain the limit of of ftheis slope {x|xof ≥the 1}, secant the left-hand line foundlimit,<br />
in (a)<br />
lim x − 1 makes no sense. But as h lim → 0. x − 1 = 0 suggests how f behaves near and<br />
x→1 − x→1 +<br />
Applications y and Extensions<br />
to the right of 1. See Figure(d) 14 and What Table is the5. slope They of suggest the tangent limlinef to(x) the= graph 0. of f at the<br />
point P = (2, f (2))? x→1 +<br />
In Problems 2 37–40, sketch a graph of a function with the given<br />
(e) On the same set of axes, graph f and the tangent line to f at<br />
properties. Answers will vary.<br />
TABLE 5<br />
1<br />
P = (2, f (2)).<br />
37. lim f (x) = 3; lim f (x) = 3; lim f (x) = 1;<br />
x approaches 1 from the right<br />
x→2 x→3− x→3 +<br />
−−−−−−−−−−−−−−−−−−−−−→<br />
f (2) = 3; f (3) = 1<br />
54. Slope of a Tangent Line For f (x) = x 2 − 1:<br />
1 2 3 4 5 6 x<br />
x 1.009 1.0009 1.00009 1.000009 1.0000009 → 1<br />
38. lim f (x) = 0; lim f (x) =−2; lim<br />
=−2;<br />
(a) Find the slope m sec of the secant line containing the<br />
Figure x→−1 14 f (x) = √ f (x) = √ x − 1 0.0949 0.03 0.00949 0.003 0.000949 f (x) approaches 0<br />
xx→2 − 1− x→2 +<br />
points P = (−1, f (−1)) and Q = (−1 + h, f (−1 + h)).<br />
f (−1) is not defined; f (2) =−2<br />
39. lim f (x) = 4;<br />
x→1<br />
lim f (x) =−1;<br />
x→0− lim f (x) = 0;<br />
x→0 +<br />
(b) Use the result from (a) NOW to complete WORK the AP® following Practicetable:<br />
Problem 1.<br />
f (0) =−1; f (1) = 2<br />
Using numeric tables and/orhgraphs −0.1gives −0.01us−0.001 an idea−0.0001 of what a0.0001 limit might 0.001 0.01 be. That 0.1<br />
40. lim f (x) = 2;<br />
x→2<br />
lim f (x) = 0;<br />
x→−1 lim is, these methods suggest a limit,<br />
f (x) = 1;<br />
m sec<br />
but there are dangers in using these methods, as the<br />
x→1 following example illustrates.<br />
f (−1) = 1; f (2) = 3<br />
(c) Investigate the limit of the slope of the secant line found<br />
EXAMPLE 7 Investigatingin a(a) Limit as h → 0.<br />
In Problems 41–50, use either a graph or a table to investigate<br />
(d) What is the slope of the tangent line to the graph of f at the<br />
each limit.<br />
Investigate lim sin π<br />
x→0 x . 2 point P = (−1, f (−1))?<br />
|x − 5|<br />
|x − 5|<br />
41. lim<br />
42. lim<br />
43. lim<br />
x→5 + x − 5<br />
x→5 − x − 5<br />
<br />
x→ 12<br />
2x<br />
(e) On the same set of axes, graph f and the tangent line to f<br />
Solution The −<br />
domain of the function at P = (−1, f (x) f = (−1)). sin π is {x|x = 0}.<br />
x<br />
2<br />
PAGE<br />
44. lim <br />
x→ 12<br />
2x 45. lim<br />
+ <br />
x→ 23<br />
2x 46. Suppose lim<br />
− <br />
x→ 23<br />
2x we let<br />
+<br />
85 x approach 55. (a) Investigate zero in thelimfollowing cos π byway:<br />
using a table and evaluating the<br />
x→0 x<br />
function f (x) = cos π TABLE 47. lim6<br />
|x|−x 48. lim |x|−x<br />
x at<br />
x→2 + x→2 −<br />
x approaches 0 from the left<br />
x =− 1<br />
3 3 2 , − 1 4 , − 1 8 , − 1 x<br />
10 , approaches − 1 12 ,..., 1<br />
0 from<br />
12 , 1 10 , the 1 8 , 1 right<br />
4 , 1 2 .<br />
49. lim x−x 50. lim<br />
−−−−−−−−−−−−−−−−−−−−→<br />
x−x<br />
←−−−−−−−−−−−−−−−−−−−−−<br />
x→2 + x→2<br />
x − 1<br />
− 1 − 1 − 1<br />
51. Slope of a Tangent Line For f (x) = 3x 2 (b) Investigate lim cos π 1 1 1 1<br />
→ 0 ←<br />
10 100<br />
by using a table and evaluating the<br />
: 1000 10,000<br />
x→0 x10,000<br />
1000 100 10<br />
f (x)(a) = Find sin π the slope of0the secant line 0 containing0the points (2, 12) 0 f (x) approaches function f (x) 0 = cos π x at 0 0 0 0<br />
x 2<br />
and (3, 27).<br />
(b) Find the slope of the secant line containing the points (2, 12)<br />
x =−1, − 1 3 , − 1 5 , − 1 7 , − 1 9 ,..., 1 9 , 1 7 , 1 5 , 1 Table 6 suggests that lim sin π 3 , 1.<br />
and (x, f (x)), x = 2.<br />
x→0 x = 0. 2<br />
(c) Compare the results from (a) and (b). What do you conclude<br />
(c) Create a table to investigate the slope of the tangent<br />
Now suppose<br />
line to the<br />
we let x approach zero as follows:<br />
about the limit? Why do you think this happens? What is<br />
graph of f at 2 using the result from (b).<br />
TABLE your view about using a table to draw a conclusion about<br />
(d) 7On the same set of axes, graph f , the tangent line to the graph<br />
limits?<br />
of f at the point (2,<br />
x<br />
12),<br />
approaches<br />
and the secant<br />
0 from<br />
line<br />
the<br />
from<br />
left<br />
(a).<br />
x approaches 0 from the right<br />
−−−−−−−−−−−−−−−−−−−−→<br />
(d) Use technology to graph f . Begin with the x-window<br />
52. Slope of a Tangent Line For f (x) = x 3 ←−−−−−−−−−−−−−−−−−−−−−<br />
:<br />
[−2π, 2π] and the y-window [−1, 1]. If you were finding<br />
x − 2 − 2 − 2 − 2 − 2 2 2 2 2 2<br />
→ 0<br />
(a) Find the slope of the secant line containing the points (2, 8)<br />
lim<br />
←<br />
3 5 7 9 11<br />
f (x) using a11<br />
graph, what 9 would you 7 conclude? 5 Zoom3in<br />
x→0<br />
f (x) = sin and (3, 27). 0.707 0.707 0.707 0.707 0.707 f (x) approaches on the 0.707 graph. Describe 0.707 what 0.707 you see. 0.707 (Hint: Be 0.707 sure your 0.707<br />
(b) Findx the slope of the secant line containing the points (2, 8)<br />
calculator is set to the radian mode.)<br />
and (x, f (x)), x = 2.<br />
56. (a) Investigate lim cos π by using a table and evaluating the<br />
(c) Create a table to investigate the slope of the tangent line to the<br />
x→0 x2 Table 7 suggests that lim sin π √<br />
2<br />
graph of f at 2 using the result from (b).<br />
function f (x) = cos π x→0 x = 2 2 ≈ 0.707. at x =−0.1, −0.01, −0.001,<br />
(d) On the same set of axes, graph f , the tangent line to the graph<br />
x2 In fact, by carefully selecting x, we can make f appear to approach any number in<br />
of f at the point (2, 8), and the secant line from (a).<br />
−0.0001, 0.0001, 0.001, 0.01, 0.1.<br />
the interval [−1, 1].<br />
Teaching Tip<br />
Have students create their own piecewise<br />
functions on graph paper. Ask them to write 3 or<br />
4 limit questions based upon their (well-labeled)<br />
graph. Point out to students that being able to<br />
write out and explain piecewise functions so<br />
that another student can follow means that they<br />
have to be very clear. Reinforce good habits and<br />
good explanations. Then they can trade with one<br />
another, find the limits, and discuss the solutions<br />
with each other. Khan Academy offers explanatory<br />
videos, as well as a practice video, on piecewise<br />
functions.<br />
WEB SITE<br />
Graphfree: The Graphfree site is an easy tool<br />
for making piecewise graphs to create additional<br />
examples. Make sure you change the plot type to<br />
Piecewise. A link to this resource is available on<br />
the Additional Chapter 1 Resources document,<br />
available for download.<br />
R<br />
N<br />
D<br />
84<br />
Chapter 1 • Limits and Continuity<br />
TE_<strong>Sullivan</strong>_Chapter01_PART 0.indd 13<br />
11/01/17 9:52 am