Sullivan Microsite DigiSample

You also want an ePaper? Increase the reach of your titles
YUMPU automatically turns print PDFs into web optimized ePapers that Google loves.
<strong>Sullivan</strong> AP˙<strong>Sullivan</strong>˙Chapter01 October 8, 2016 17:4<br />
<strong>Sullivan</strong><br />
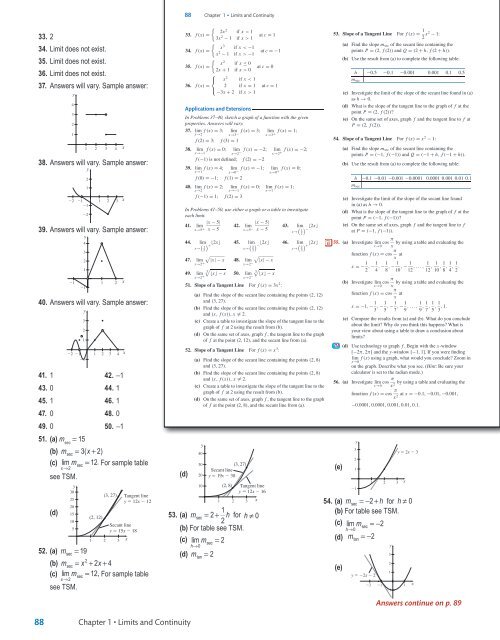
88 Chapter 1 • Limits and Continuity<br />
33. 2<br />
34. Limit does not exist.<br />
35. Limit does not exist.<br />
36. Limit does not exist.<br />
37. Answers will vary. Sample answer:<br />
y<br />
4<br />
3<br />
2<br />
1<br />
1 2 3 4<br />
38. Answers will vary. Sample answer:<br />
y<br />
2<br />
1<br />
22 21 1 2 3 x<br />
21<br />
22<br />
39. Answers will vary. Sample answer:<br />
y<br />
21<br />
4<br />
3<br />
2<br />
1<br />
21<br />
1 2<br />
40. Answers will vary. Sample answer:<br />
y<br />
3<br />
2<br />
1<br />
22 21 1 2 3 4 x<br />
21<br />
41. 1 42. −1<br />
43. 0 44. 1<br />
45. 1 46. 1<br />
47. 0 48. 0<br />
49. 0 50. −1<br />
51. (a) m sec<br />
= 15<br />
(b) msec = 3( x+<br />
2)<br />
(c) lim m = 12. For sample table<br />
x→2<br />
see TSM.<br />
(d)<br />
y<br />
30<br />
25<br />
20<br />
15<br />
10<br />
5<br />
sec<br />
(2, 12)<br />
(3, 27)<br />
1 2 3<br />
x<br />
x<br />
Tangent line<br />
y 12x 12<br />
Secant line<br />
y 15x 18<br />
52. (a) msec<br />
= 19<br />
2<br />
(b) msec<br />
= x + 2x<br />
+ 4<br />
(c) lim msec<br />
= 12. For sample table<br />
x→2<br />
see TSM.<br />
x<br />
33.<br />
2x 2 if x < 1<br />
f (x) =<br />
3x 2 − 1 if x > 1<br />
at c = 1<br />
34.<br />
x 3 if x < −1<br />
f (x) =<br />
x 2 − 1<br />
if x > −1<br />
at c =−1<br />
35.<br />
x 2 if x ≤ 0<br />
f (x) =<br />
at c = 0<br />
2x + 1 if x > 0<br />
⎧<br />
⎨<br />
x 2 if x < 1<br />
36. f (x) =<br />
2 if x = 1<br />
at c = 1<br />
⎩<br />
−3x + 2 if x > 1<br />
Applications and Extensions<br />
In Problems 37–40, sketch a graph of a function with the given<br />
properties. Answers will vary.<br />
37. lim<br />
f (x) = 3;<br />
x→2 lim<br />
f (x) = 3;<br />
x→3 − lim<br />
f (x) = 1;<br />
x→3 + f (2) = 3; f (3) = 1<br />
38. lim<br />
f (x) = 0;<br />
x→−1 lim<br />
f (x) =−2;<br />
x→2 − lim<br />
f (x) =−2;<br />
x→2 + f (−1) is not defined; f (2) =−2<br />
39. lim<br />
f (x) = 4;<br />
x→1 lim<br />
f (x) =−1;<br />
x→0 − lim<br />
f (x) = 0;<br />
x→0 + f (0) =−1; f (1) = 2<br />
40. lim<br />
f (x) = 2;<br />
x→2 lim<br />
f (x) = 0;<br />
x→−1 lim<br />
f (x) = 1;<br />
x→1 f (−1) = 1; f (2) = 3<br />
In Problems 41–50, use either a graph or a table to investigate<br />
each limit.<br />
|x − 5|<br />
|x − 5|<br />
41. lim<br />
42. lim<br />
43. lim<br />
2x<br />
x→5 + x − 5<br />
x→5 − x − 5<br />
x→ 12<br />
2x<br />
−<br />
44. lim 2x 2x 2x<br />
x→ 12<br />
2x 45. lim<br />
+ <br />
x→ 23<br />
2x 46. lim<br />
− <br />
x→ 23<br />
2x<br />
+<br />
47. lim<br />
|x|−x 48. lim<br />
|x|−x<br />
x→2 + x→2 −<br />
3 3 49. lim x−x x−x 50. lim x−x x−x<br />
x→2 + x→2 − 51. Slope of a Tangent Line For f (x) = 3x 2 :<br />
(a) Find the slope of the secant line containing the points (2, 12)<br />
and (3, 27).<br />
(b) Find the slope of the secant line containing the points (2, 12)<br />
and (x, f (x)), x = = 2.<br />
(c) Create a table to investigate the slope of the tangent line to the<br />
graph of f at 2 using the result from (b).<br />
(d) On the same set of axes, graph f , the tangent line to the graph<br />
of f at the point (2, 12), and the secant line from (a).<br />
52. Slope of a Tangent Line For f (x) = x 3 :<br />
(d)<br />
(a) Find the slope of the secant line containing the points (2, 8)<br />
and (3, 27).<br />
(b) Find the slope of the secant line containing the points (2, 8)<br />
and (x, f (x)), x = = 2.<br />
(c) Create a table to investigate the slope of the tangent line to the<br />
graph of f at 2 using the result from (b).<br />
(d) On the same set of axes, graph f , the tangent line to the graph<br />
of f at the point (2, 8), and the secant line from (a).<br />
y<br />
40<br />
30<br />
(3, 27)<br />
Secant line<br />
20 y 5 19x 2 30<br />
10<br />
(2, 8)<br />
1 2 3<br />
Tangent line<br />
y 5 12x 2 16<br />
1<br />
53. (a) msec = 2+<br />
h for h ≠ 0<br />
2<br />
(b) For table see TSM.<br />
(c) lim m = 2<br />
h→0<br />
sec<br />
(d) m = 2<br />
tan<br />
x<br />
53. Slope of a Tangent Line For f (x) = 1 2 x2 − 1:<br />
(a) Find the slope m sec of the secant line containing the<br />
points P = (2, f (2)) and Q = (2 + h, f (2 + h)).<br />
(b) Use the result from (a) to complete the following table:<br />
h −0.5 −0.1 −0.001 0.001 0.1 0.5<br />
m sec<br />
(c) Investigate the limit of the slope of the secant line found in (a)<br />
as h → 0.<br />
(d) What is the slope of the tangent line to the graph of f at the<br />
point P = (2, f (2))?<br />
(e) On the same set of axes, graph f and the tangent line to f at<br />
P = (2, f (2)).<br />
54. Slope of a Tangent Line For f (x) = x 2 − 1:<br />
(a) Find the slope m sec of the secant line containing the<br />
points P = (−1, f (−1)) and Q = (−1 + h, f (−1 + h)).<br />
(b) Use the result from (a) to complete the following table:<br />
h −0.1 −0.01 −0.001 −0.0001 0.0001 0.001 0.01 0.1<br />
m sec<br />
(c) Investigate the limit of the slope of the secant line found<br />
in (a) as h → 0.<br />
(d) What is the slope of the tangent line to the graph of f at the<br />
point P = (−1, f (−1))?<br />
(e) On the same set of axes, graph f and the tangent line to f<br />
at P = (−1, f (−1)).<br />
PAGE<br />
85 55. (a) Investigate lim cos π by using a table and evaluating the<br />
x→0 x function f (x) = cos π x at<br />
x =− 1 2 , − 1 4 , − 1 8 , − 1 10 , − 1 12 ,..., 1<br />
12 , 1 10 , 1 8 , 1 4 , 1 2 .<br />
(b) Investigate lim<br />
cos π by using a table and evaluating the<br />
x→0 x function f (x) = cos π x at<br />
x =−1, − 1 3 , − 1 5 , − 1 7 , − 1 9 ,..., 1 9 , 1 7 , 1 5 , 1 3 , 1.<br />
(c) Compare the results from (a) and (b). What do you conclude<br />
about the limit? Why do you think this happens? What is<br />
your view about using a table to draw a conclusion about<br />
limits?<br />
(d) Use technology to graph f . Begin with the x-window<br />
[−2π, 2π] and the y-window [−1, 1]. If you were finding<br />
lim<br />
f (x) using a graph, what would you conclude? Zoom in<br />
x→0 on the graph. Describe what you see. (Hint: Be sure your<br />
calculator is set to the radian mode.)<br />
56. (a) Investigate lim<br />
cos π by using a table and evaluating the<br />
x→0 x 2 function f (x) = cos π at x =−0.1, −0.01, −0.001,<br />
x 2 −0.0001, 0.0001, 0.001, 0.01, 0.1.<br />
(e)<br />
3<br />
2<br />
1<br />
1<br />
y<br />
1 2 3<br />
y 2x 3<br />
54. (a) msec =− 2+<br />
h for h ≠ 0<br />
(b) For table see TSM.<br />
(c) lim msec<br />
=−2<br />
h→0<br />
(d) m =−2<br />
(e)<br />
tan<br />
y 5 22x 2 2<br />
22 21<br />
y<br />
3<br />
2<br />
1<br />
21<br />
x<br />
1<br />
x<br />
Answers continue on p. 89<br />
88<br />
Chapter 1 • Limits and Continuity<br />
TE_<strong>Sullivan</strong>_Chapter01_PART 0.indd 17<br />
11/01/17 9:52 am