Sullivan Microsite DigiSample

Create successful ePaper yourself
Turn your PDF publications into a flip-book with our unique Google optimized e-Paper software.
<strong>Sullivan</strong> AP˙<strong>Sullivan</strong>˙Chapter01 October 8, 2016 17:4<br />
Section 1.1 • Limits of Functions Using Section Numerical 1.1 • Assess and Graphical Your Understanding Techniques 89 83<br />
(b) Investigate lim cos π by using a table and Solution evaluating Thethe<br />
function f is a(c) piecewise-defined Graph the function function. C. Its graph is shown in Figure 12.<br />
x→0 x2 y<br />
function f (x) = cos π Observe that as x approaches<br />
x 2 at<br />
(d)<br />
2<br />
Use<br />
from<br />
the graph<br />
the left,<br />
to investigate<br />
the value<br />
lim<br />
of f<br />
C(w)<br />
is close<br />
and<br />
to<br />
lim<br />
7,<br />
C(w).<br />
and as<br />
Do<br />
x<br />
w→1− w→1 +<br />
10<br />
approaches 2 from the right, the value of f is close to 7. In fact, we can make the value<br />
(2, 10)<br />
x =− 2 3 , − 2 5 , − 2 7 , − 2 9 ,..., 2 9 , 2 7 , 2 5 , 2 of f as close as we please to 7 these by choosing suggest that x sufficiently lim C(w) exists?<br />
3 .<br />
w→1<br />
close to 2 but not equal to 2.<br />
This suggests lim f (x) = 7. ■<br />
(e) Use the graph to investigate lim C(w) and lim x→2<br />
w→12− w→12<br />
(c) Compare the results from (a) and (b). What do you conclude<br />
7<br />
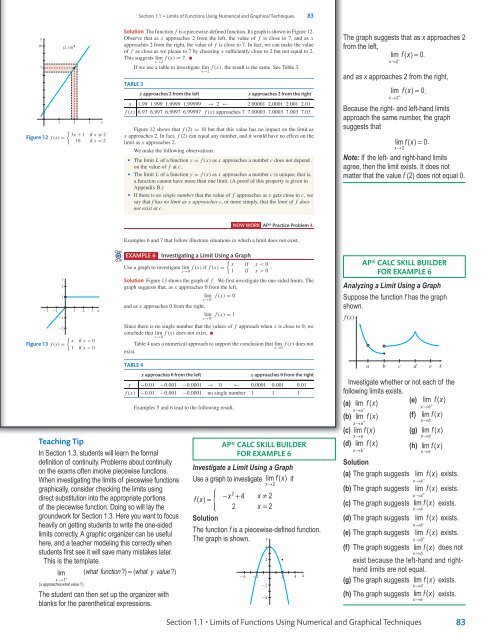
If we use a table to investigate lim f (x), the result is the same. See Table 3.<br />
Do these<br />
about the limit? Why do you think this happens? What is your<br />
x→2 suggest that lim C(w) exists?<br />
w→12<br />
view about using a table to draw a conclusion about limits? (f) Use the graph to investigate lim<br />
TABLE 3<br />
C(w).<br />
w→0 +<br />
(d) Use technology to graph f . Begin with the x-window<br />
(g) Use the graph to investigate lim w→13<br />
[−2π, 2π] and the y-window [−1, 1]. If you were x approaches finding 2 from the left<br />
x approaches − 2 from the right<br />
−−−−−−−−−−−−−−−−−−−−−→<br />
←−−−−−−−−−−−−−−−−−−−−−−<br />
lim f (x) using a graph, what would you conclude? Zoom in 61. Correlating Student Success to Study Time Professor Smith<br />
x→0 x 1.99 1.999 1.9999 1.99999 → 2 ← 2.00001 2.0001 2.001 2.01<br />
on the graph. Describe what you see. (Hint: Be sure your<br />
claims that a student’s final exam score is a function of the time t<br />
f (x) 6.97 6.997 6.9997 6.99997<br />
calculator is set to the radian mode.)<br />
(in hours) that f (x) the approaches student studies. 7 7.00003 He claims 7.0003 that the7.003 closer 7.03 to<br />
PAGE<br />
x − 8<br />
seven hours one studies, the closer to 100% the student scores<br />
85 57. (a) Use a table 1 to investigate 2 3 limx<br />
.<br />
x→2 2<br />
on the final. He claims that studying significantly less than seven<br />
(b) How close must { x be to 2, so that f (x) is within<br />
Figure<br />
0.1 of<br />
12<br />
the<br />
shows that f hours (2) = may 10cause but that one to this bevalue underprepared has no impact for the test, on the while limit as<br />
3x + 1 if x = 2<br />
Figure 12 limit? f (x) =<br />
x approaches 2. In fact, f (2) studying can equal significantly any number, more than and seven it would hours have mayno cause effect on the<br />
10 if x = 2<br />
(c) How close must x be to 2, so that f (x) islimit within as0.01 x approaches of the 2. “burnout.”<br />
limit?<br />
58. (a) Use a table to investigate lim(5 − 2x).<br />
x→2<br />
We make the following(a) observations: Write Professor Smith’s claim symbolically as a limit.<br />
• The limit L of a function (b) y Write = f (x) Professor as x approaches Smith’s claima number using thec ε-δ does definition not depend<br />
(b) How close must x be to 2, so that f (x) is within on the 0.1 of value the of f at c. of limit.<br />
limit?<br />
• The limit L of a function Source: y = Submitted f (x) as xbyapproaches the students aofnumber Millikin University. c is unique; that is,<br />
(c) How close must x be to 2, so that f (x) is within a function 0.01 of the cannot have more than one limit. (A proof of this property is given in<br />
62. The definition of the slope of the tangent line to the graph of<br />
limit?<br />
Appendix B.)<br />
f (x) − f (c)<br />
59. First-Class Mail As of April<br />
• If there is no single number y = f that (x) at the the value point of (c, f f approaches (c)) is m tan = aslim<br />
.<br />
x→c<br />
x gets<br />
2016, the U.S. Postal Service<br />
xclose − c to c, we<br />
say that f has no limit as x approaches c, or more simply, that the limit of f does<br />
charged $0.47 postage for<br />
Another way to express this slope is to define a new variable<br />
not exist at c.<br />
first-class letters weighing up to<br />
h = x − c. Rewrite the slope of the tangent line m tan using h and c.<br />
and including 1 ounce, plus a flat<br />
63. If f (2) = 6, can you conclude anything about lim f (x)? Explain<br />
fee of $0.21 for each additional<br />
x→2<br />
your reasoning. NOW WORK AP® Practice Problem 4.<br />
or partial ounce up to and<br />
64. If lim f (x) = 6, can you conclude anything about f (2)? Explain<br />
including 3.5 ounces. First-class<br />
x→2<br />
letter rates do not apply to letters Examples 6 and 7 that follow your illustrate reasoning. situations in which a limit does not exist.<br />
weighing more than 3.5 ounces.<br />
65. The graph of f (x) = x − 3<br />
CALC<br />
is a straight line with a point punched<br />
Source: U.S. Postal Service Notice 123 EXAMPLE 6 Investigating 3 − x<br />
out. a Limit Using a Graph<br />
CLIP<br />
{<br />
(a) Find a function C that models the first-class postage charged, (a) What straight line and x<br />
what if<br />
point? x < 0<br />
Use a graph to investigate lim f (x) if f (x) =<br />
in dollars, for a letter weighing w ounces. Assume w>0.<br />
x→0 1 if x > 0 .<br />
(b) Use the graph of f to investigate the one-sided limits of f as<br />
(b) What is the y domain of C?<br />
Solution Figure 13 shows the graph x approaches of f . We 3. first investigate the one-sided limits. The<br />
(c) Graph the2<br />
function C.<br />
graph suggests that, as x approaches (c) Does the 0 from graphthe suggest left, that lim f (x) exists? If so, what is it?<br />
(d) Use the graph to investigate lim C(w) and lim C(w). Do<br />
x→3<br />
1<br />
w→2− w→2 + lim<br />
66. (a) Use a table to investigate x→0 lim(1 + x)<br />
these suggest that lim C(w) exists?<br />
.<br />
x→0<br />
w→2<br />
(e) Use the graph to investigate lim and as x approaches 0 from(b) theUse right, graphing technology to graph g(x) = (1 + x) 1/x .<br />
2 1 1 2 3 x<br />
w→0 + (c) What lim do (a) and (b) suggest about lim(1 + x) 1/x ?<br />
1<br />
(f) Use the graph to investigate lim x→0 + x→0<br />
w→3.5 − CAS (d) Find lim(1 + x) 1/x .<br />
2<br />
Since there is no single number that x→0<br />
the values of f approach when x is close to 0, we<br />
60. First-Class Mail As of April 2016, the U.S. conclude Postal Service that lim f (x) does not exist. ■<br />
charged $0.94 postage { for first-class large envelope weighing x→0<br />
x if x < 0<br />
up to<br />
Figure and13 including f (x) = 1 ounce, plus a flat fee of $0.21 for each Tableadditional<br />
4 uses a numerical approach to support the conclusion that lim f (x) does not<br />
1 if x > 0<br />
or partial ounce up to and including 13 ounces. First-class rates do Challenge Problems<br />
x→0<br />
exist.<br />
not apply to large envelopes weighing more than 13 ounces. For Problems 67–70, investigate each of the following limits.<br />
Source: U.S. Postal Service Notice 123<br />
{<br />
TABLE 4<br />
1 if x is an integer<br />
f (x) =<br />
(a) Find a function C that models the first-class postage x approaches charged, 0 from the left<br />
0 if xis approaches not an integer 0 from the right<br />
in dollars, for a large envelope weighing w ounces. −−−−−−−−−−−−−−−−−−−−→<br />
Assume<br />
←−−−−−−−−−−−−−−−−−−−−−<br />
w>0.<br />
x −0.01 −0.00167. −0.0001 lim f (x) x→2<br />
→68. 0 lim f ←(x) x→1/2<br />
69. 0.0001 lim f (x) 0.001 70.<br />
x→3<br />
lim 0.01<br />
(b) What is the domain of C?<br />
f (x) −0.01 −0.001 −0.0001 no single number 1 1 1<br />
Teaching Tip<br />
In Section 1.3, students will learn the formal<br />
definition of continuity. Problems about continuity<br />
on the exams often involve piecewise functions.<br />
When investigating the limits of piecewise functions<br />
graphically, consider checking the limits using<br />
direct substitution into the appropriate portions<br />
of the piecewise function. Doing so will lay the<br />
groundwork for Section 1.3. Here you want to focus<br />
heavily on getting students to write the one-sided<br />
limits correctly. A graphic organizer can be useful<br />
here, and a teacher modeling this correctly when<br />
students first see it will save many mistakes later.<br />
This is the template.<br />
lim ( what function ?) = ( what yvalue ?)<br />
x → 1<br />
+<br />
( x approaches what value ?)<br />
The student can then set up the organizer with<br />
blanks for the parenthetical expressions.<br />
Kathryn Sidenstricker /Dreamstime.com<br />
Examples 5 and 6 lead to the following result.<br />
AP® CaLC skill builder<br />
for example 6<br />
Investigate a Limit Using a Graph<br />
Use a graph to investigate lim fx ( ) if<br />
x→2<br />
⎧⎪<br />
2<br />
fx ( ) =<br />
− x + 4 x ≠ 2<br />
⎨<br />
⎩⎪ 2 x = 2<br />
Solution<br />
The function f is a piecewise-defined function.<br />
The graph is shown. y<br />
24<br />
22<br />
4<br />
2<br />
22<br />
24<br />
2<br />
4<br />
x<br />
The graph suggests that as x approaches 2<br />
from the left,<br />
lim fx ( ) = 0.<br />
x→2<br />
−<br />
and as x approaches 2 from the right,<br />
lim fx ( ) = 0.<br />
x→ 2<br />
+<br />
Because the right- and left-hand limits<br />
approach the same number, the graph<br />
suggests that<br />
lim fx ( ) = 0.<br />
x→2<br />
Note: If the left- and right-hand limits<br />
agree, then the limit exists. It does not<br />
matter that the value f (2) does not equal 0.<br />
AP® CaLC skill builder<br />
for example 6<br />
Analyzing a Limit Using a Graph<br />
Suppose the function f has the graph<br />
shown.<br />
f (x)<br />
a b c d e<br />
Investigate whether or not each of the<br />
following limits exists.<br />
(a) lim fx ( )<br />
(e) lim fx ( )<br />
x→a<br />
− x→ b<br />
+<br />
(b) lim fx ( ) (f) lim fx ( )<br />
x→ a<br />
+ x→b<br />
(c) lim fx ( ) (g) lim fx ( )<br />
x→a<br />
x→d<br />
(d) lim fx ( ) (h) lim fx ( )<br />
x→b<br />
− x→e<br />
Solution<br />
(a) The graph suggests lim fx ( ) exists.<br />
x→a<br />
−<br />
(b) The graph suggests lim fx ( ) exists.<br />
x→ a<br />
+<br />
(c) The graph suggests lim fx ( ) exists.<br />
x→a<br />
(d) The graph suggests lim fx ( ) exists.<br />
x→b<br />
−<br />
(e) The graph suggests lim fx ( ) exists.<br />
x→ b<br />
+<br />
(f) The graph suggests lim fx ( ) does not<br />
x→b<br />
exist because the left-hand and righthand<br />
limits are not equal.<br />
(g) The graph suggests lim fx ( ) exists.<br />
(h) The graph suggests<br />
x→d<br />
x→e<br />
x<br />
lim fx ( ) exists.<br />
x→0 f (x) 83<br />
Section 1.1 • Limits of Functions Using Numerical and Graphical Techniques<br />
TE_<strong>Sullivan</strong>_Chapter01_PART 0.indd 12<br />
11/01/17 9:52 am