Sullivan Microsite DigiSample

You also want an ePaper? Increase the reach of your titles
YUMPU automatically turns print PDFs into web optimized ePapers that Google loves.
<strong>Sullivan</strong> AP˙<strong>Sullivan</strong>˙Chapter01 October8, 8, 2016 17:4<br />
<strong>Sullivan</strong><br />
TRM Alternate Examples Section 1.1<br />
You can find the Alternate Examples for<br />
this section in PDF format in the Teacher’s<br />
Resource Materials.<br />
TRM AP® Calc Skill Builders<br />
Section 1.1<br />
You can find the AP ® Calc Skill Builders for<br />
this section in PDF format in the Teacher’s<br />
Resource Materials.<br />
WEB SITE<br />
Many Web sites provide help for teaching<br />
and learning calculus. Some provide<br />
advice and concept development videos<br />
or applets, while others offer step-by-step<br />
support in working calculus problems.<br />
Three very useful sites:<br />
• Khan Academy is a well-known source<br />
of good tutorials, and the College Board<br />
has partnered with Khan to provide<br />
instructional videos on released AP ®<br />
Exam problems. https://www.<br />
khanacademy.org/math/calculus-home/<br />
ap-calc-topic<br />
• Lin McMullin’s Teaching Calculus blog<br />
offers an extensive set of resources for<br />
teachers and students, including<br />
instructional videos for most topics,<br />
suggestions for addressing the MPACs,<br />
and other helpful information.<br />
https://teachingcalculus.com/<br />
• The Wolfram|Alpha site offers help with<br />
solving many types of problems by “doing<br />
dynamic computations based on a vast<br />
collection of built-in data, algorithms, and<br />
methods.” It offers much helpful guidance<br />
to students when they are stuck and<br />
looking for quick specific help.<br />
https://www.wolframalpha.com/<br />
Links to these resources, and others,<br />
are found in the Additional Chapter 1<br />
Resources document, available for download.<br />
88 78 Chapter 1 • Limits and Continuity<br />
T<br />
2x 2 if x < 1<br />
33. f (x) =<br />
3x 2 at c = 1<br />
he concept of a limit 53. is Slope central of a to Tangent calculus. Line To understand For f (x) = calculus, 1<br />
− 1 if x > 1<br />
2 x2 − 1: it is essential to<br />
know what it means for a function to have a limit, and then how to find a limit of a<br />
x 3 function. Chapter 1 explains (a) what Finda the limit slope is, shows m<br />
if x < −1<br />
sec ofhow the secant to findline a limit containing of a function, the and<br />
34. f (x) =<br />
x 2 at c =−1 demonstrates how to prove thatpoints limitsP exist = (2, using f (2)) the anddefinition Q = (2 + of h, limit. f (2 + h)).<br />
− 1 if x > −1<br />
We begin the chapter using (b) Use numerical the result and from graphical (a) to complete approaches the following to explore table: the idea<br />
x 2 if x ≤ 0<br />
35. f (x) =<br />
at c = 0 of a limit. Although these methods seem to work well, there are instances in which they<br />
2x + 1 if x > 0<br />
⎧<br />
fail to identify the correct limit. h −0.5 −0.1 −0.001 0.001 0.1 0.5<br />
⎨ x 2 if x < 1<br />
In Section 1.2, we provide analytic m sec techniques for finding limits. Some of the proofs<br />
36. f (x) = 2 if x = 1 at c = 1<br />
⎩<br />
of these techniques are found in Section 1.6, others in Appendix B. A limit found by<br />
−3x + 2 if x > 1<br />
correctly applying these analytic (c) Investigate techniques theis limit precise; of thethere slopeis ofno thedoubt secantthat lineit found is correct. in (a)<br />
as h → 0.<br />
In Sections 1.3–1.5, we continue to study limits and some ways that they are used.<br />
(d) What is the slope of the tangent line to the graph of f at the<br />
Applications and Extensions<br />
For example, we use limits to define continuity, an important property of a function.<br />
point P = (2, f (2))?<br />
In Problems 37–40, sketch a graph of a function with the Section given 1.6 provides a(e) precise On the definition same set of ofaxes, limit, graph the so-called f and the tangent ε-δ (epsilon-delta)<br />
line to f at<br />
properties. Answers will vary.<br />
definition, which we use to showP = when (2, f a(2)).<br />
limit does, and does not, exist. ■<br />
37. lim f (x) = 3; lim f (x) = 3; lim f (x) = 1;<br />
x→2 x→3− x→3 +<br />
f (2) = 3; f (3) = 1<br />
54. Slope of a Tangent Line For f (x) = x 2 − 1:<br />
1.1 Limits of Functions Using Numerical<br />
38. lim f (x) = 0; lim f (x) =−2; lim f (x) =−2;<br />
(a) Find the slope m sec of the secant line containing the<br />
x→−1 x→2− x→2 + and Graphical Techniques<br />
points P = (−1, f (−1)) and Q = (−1 + h, f (−1 + h)).<br />
f (−1) is not defined; f (2) =−2<br />
39. lim f (x) = 4; lim f (x) =−1; lim f<br />
OBJECTIVES<br />
(x) = 0;<br />
When you(b) finish Usethis the result section, from you (a) to should complete be able the following to: table:<br />
x→1 x→0− x→0 +<br />
AP®<br />
f<br />
EXAM<br />
(0) =−1;<br />
INSIGHT<br />
f (1)<br />
Limits<br />
= 2<br />
is the first 1 Discuss the slope of a tangent line to a graph (p. 78)<br />
h −0.1 −0.01 −0.001 −0.0001 0.0001 0.001 0.01 0.1<br />
Big Idea in the AP® Calculus curriculum.<br />
40. lim f (x) = 2; lim f (x) = 0; lim 2 Investigate a limit using a table (p. 80)<br />
f (x) = 1;<br />
m sec<br />
x→2 x→−1 x→1 3 Investigate a limit using a graph (p. 82)<br />
f (−1) = 1; f (2) = 3<br />
(c) Investigate the limit of the slope of the secant line found<br />
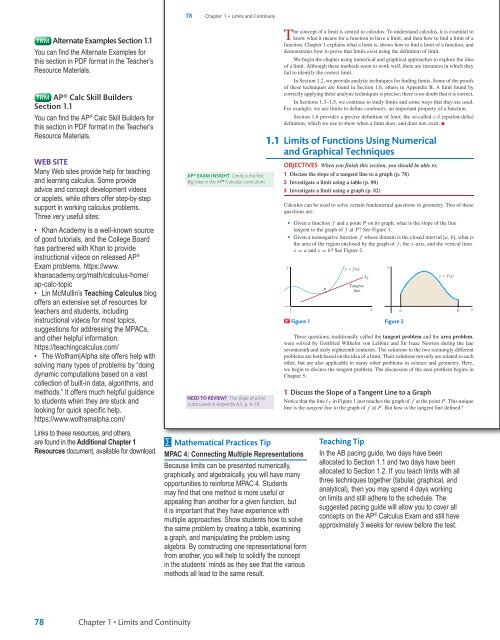
Calculus can be used to solve certain (a) asfundamental h → 0. questions in geometry. Two of these<br />
In Problems 41–50, use either a graph or a table toquestions investigate are:<br />
(d) What is the slope of the tangent line to the graph of f at the<br />
each limit.<br />
point P = (−1, f (−1))?<br />
|x − 5|<br />
|x − 5|<br />
41. lim<br />
42. lim<br />
43.<br />
• Given<br />
lim<br />
a<br />
x→5 + x − 5<br />
x→5 − x − 5<br />
<br />
x→ 12<br />
2x<br />
function f and(e) a point On theP same on its set graph, of axes, what graph is the f and slope the tangent of the line<br />
to f<br />
tangent −<br />
to the graph of f at atP? P = See (−1, Figure f (−1)). 1.<br />
• Given a nonnegative function f whose domain<br />
PAGE<br />
44. lim <br />
x→ 12<br />
2x 45. lim<br />
+ <br />
x→ 23<br />
2x 46. lim<br />
− <br />
x→ 23<br />
2x<br />
+<br />
85 55. (a) Investigate lim cos π is the closed interval [a, b], what is<br />
the area of the region enclosed by the by using a table evaluating the<br />
x→0<br />
graph of x f , the x-axis, and the vertical lines<br />
x = a and x = b? See Figure 2.<br />
function f (x) = cos π<br />
47. lim |x|−x 48. lim |x|−x<br />
x at<br />
x→2 + x→2 −<br />
x =− 1<br />
3 3 2 , − 1 4 , − 1 8 , − 1 10 , − 1 12 ,..., 1<br />
12 , 1 10 , 1 8 , 1 4 , 1 y<br />
y f (x)<br />
y<br />
2 .<br />
49. lim x−x 50. lim x−x<br />
x→2 + x→2 − l T<br />
51. Slope of a Tangent Line For f (x) = 3x 2 (b) Investigate lim cos π y f (x)<br />
by using a table and evaluating the<br />
:<br />
Tangent x→0 x<br />
P<br />
line<br />
(a) Find the slope of the secant line containing the points (2, 12)<br />
function f (x) = cos π x at<br />
and (3, 27).<br />
(b) Find the slope of the secant line containing the points (2, 12)<br />
x =−1, − 1 3 , − 1 5 , − 1 7 , − 1 9 ,..., 1 9 , 1 7 , 1 5 , 1 x<br />
a<br />
3 , 1. b x<br />
and (x, f (x)), x = 2.<br />
(c) Compare the results from (a) and (b). What do you conclude<br />
(c) Create a table to investigate the slope of the DFtangent Figureline 1 to the<br />
Figure 2<br />
about the limit? Why do you think this happens? What is<br />
graph of f at 2 using the result from (b).<br />
your view about using a table to draw a conclusion about<br />
(d) On the same set of axes, graph f , the tangent line to the graph<br />
These questions, traditionally limits? called the tangent problem and the area problem,<br />
of f at the point (2, 12), and the secant line from (a).<br />
were solved by Gottfried Wilhelm von Leibniz and Sir Isaac Newton during the late<br />
(d) Use technology to graph f . Begin with the x-window<br />
52. Slope of a Tangent Line For f (x) = x 3 : seventeenth and early eighteenth [−2π, centuries. 2π] and The thesolutions y-window to[−1, the1]. twoIfseemingly you were finding different<br />
problems are both based on the idea<br />
(a) Find the slope of the secant line containing the points (2, 8)<br />
lim f of (x) a limit. using Their a graph, solutions what would not you onlyconclude? are related Zoom to each in<br />
x→0<br />
other, but are also applicable to many other problems in science and geometry. Here,<br />
and (3, 27).<br />
on the graph. Describe what you see. (Hint: Be sure your<br />
we begin to discuss the tangent problem. The discussion of the area problem begins in<br />
(b) Find the slope of the secant line containing the points (2, 8)<br />
calculator is set to the radian mode.)<br />
Chapter 5.<br />
and (x, f (x)), x = 2.<br />
56. (a) Investigate lim cos π by using a table and evaluating the<br />
(c) Create a table to investigate the slope of the tangent line to the<br />
x→0 x2 graph of f at 2 using the result from (b). 1 Discuss the Slope offunction a Tangent f (x) = Line cos π to at x a=−0.1, Graph −0.01, −0.001,<br />
(d) On the same set of axes, graph f , the tangent line to the graph<br />
x2 NEED TO REVIEW? The slope of a line<br />
Notice that the line <br />
is discussed of finatAppendix the point A.3, (2, 8), p. A-18.<br />
T in Figure 1 just touches the graph of f at the point P. This unique<br />
and the secant line from (a).<br />
−0.0001, 0.0001, 0.001, 0.01, 0.1.<br />
line is the tangent line to the graph of f at P. But how is the tangent line defined?<br />
∑ Mathematical Practices Tip<br />
MPAC 4: Connecting Multiple Representations<br />
Because limits can be presented numerically,<br />
graphically, and algebraically, you will have many<br />
opportunities to reinforce MPAC 4. Students<br />
may find that one method is more useful or<br />
appealing than another for a given function, but<br />
it is important that they have experience with<br />
multiple approaches. Show students how to solve<br />
the same problem by creating a table, examining<br />
a graph, and manipulating the problem using<br />
algebra. By constructing one representational form<br />
from another, you will help to solidify the concept<br />
in the students’ minds as they see that the various<br />
methods all lead to the same result.<br />
Teaching Tip<br />
In the AB pacing guide, two days have been<br />
allocated to Section 1.1 and two days have been<br />
allocated to Section 1.2. If you teach limits with all<br />
three techniques together (tabular, graphical, and<br />
analytical), then you may spend 4 days working<br />
on limits and still adhere to the schedule. The<br />
suggested pacing guide will allow you to cover all<br />
concepts on the AP ® Calculus Exam and still have<br />
approximately 3 weeks for review before the test.<br />
78<br />
Chapter 1 • Limits and Continuity<br />
TE_<strong>Sullivan</strong>_Chapter01_PART 0.indd 7<br />
11/01/17 9:51 am