Sullivan Microsite DigiSample

You also want an ePaper? Increase the reach of your titles
YUMPU automatically turns print PDFs into web optimized ePapers that Google loves.
<strong>Sullivan</strong> AP˙<strong>Sullivan</strong>˙Chapter01 October8, 8, 2016 17:4<br />
Section 1.1 • Limits of Functions Using Section Numerical 1.1 • Assess and Graphical Your Understanding Techniques 89 79<br />
(b) Investigate lim cos π by using a table and evaluating In planethe<br />
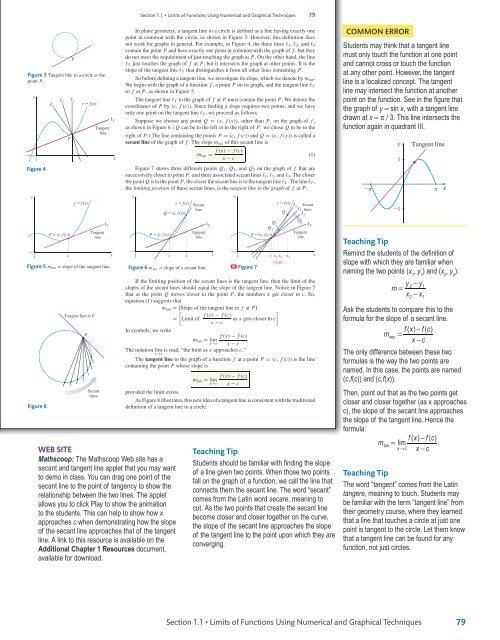
geometry, a tangent (c) Graph linethe tofunction a circleC.<br />
is defined as a line having exactly one<br />
x→0 x2 function f (x) = cos π point in common with the circle, as shown in Figure 3. However, this definition does<br />
x 2 at<br />
(d) Use the graph to investigate lim C(w) and lim C(w). Do<br />
not work for graphs in general. For example, in Figure 4, w→1 the − three lines w→1 1 + , 2 , and 3<br />
x =− 2 3 , − 2 5 , − 2 7 , − 2 9 ,..., 2 9 , 2 7 , 2 5 , 2 contain the point P and have exactly these suggest one point thatinlimcommon C(w) exists? with the graph of f , but they<br />
3 .<br />
w→1<br />
P<br />
do not meet the requirement of just touching the graph at P. On the other hand,<br />
(e) Use the graph to investigate lim C(w) and lim C(w). the line<br />
T just touches the graph of f at P, but it intersects thew→12 graph − at other points. w→12<br />
(c) Compare the results from (a) and (b). What do you conclude<br />
+ It is the<br />
slope of the tangent line <br />
about the limit? Why do you think this happens? What is your T that Do distinguishes these suggestithat fromlimallC(w) otherexists?<br />
lines containing P.<br />
w→12<br />
Figure 3 Tangent line to a circle at the<br />
view about using a table to draw a conclusion about So before limits? defining a tangent (f) Use line, thewe graph investigate to investigate its slope, lim which C(w). we denote by m<br />
point P.<br />
tan .<br />
w→0<br />
We begin with the graph of a function f , a point P on its graph, +<br />
(d) Use technology to graph f . Begin with the x-window<br />
(g) Use the graph to investigate lim C(w). and the tangent line T<br />
to f at P, as shown in Figure 5.<br />
w→13<br />
[−2π, 2π] and the y-window [−1, 1]. If you were finding<br />
− y<br />
lim f (x) l using l a graph, what would you conclude? Zoom in<br />
2 1<br />
The tangent line T 61. to Correlating the graph ofStudent f at P Success must contain to Study theTime point P. Professor We denote Smiththe<br />
x→0l y f (x)<br />
3<br />
on the graph. Describe what you see. (Hint:<br />
coordinates<br />
Be sure your<br />
of P by (c, f (c)). claims Since that afinding student’s a final slopexam requires score two is a function points, of and thewe time have t<br />
calculator is set to the radian mode.) only one point on the tangent (in hours) line T that , wethe proceed studentas studies. follows. He claims that the closer to<br />
PAGE<br />
x −l 8 T<br />
85 57. (a) Use a table to investigate lim .<br />
Suppose we choose any seven point hours Q one = studies, (x, f (x)), the closer othertothan 100% P, the onstudent the graph scoresof f ,<br />
x→2 2<br />
on the final. He claims that studying significantly less than seven<br />
Tangent as shown in Figure 6. (Q can be to the left or to the right of P; we chose Q to be to the<br />
(b) How close must x be to 2, soline<br />
that f (x) is within 0.1 of the hours may cause one to be underprepared for the test, while<br />
limit?<br />
right of P.) The line containing studying thesignificantly points P = more (c, f than (c)) seven and Q hours = (x, mayf cause (x)) is called a<br />
P<br />
secant line of the graph of<br />
(c) How close must x be to 2, so that f (x) is within 0.01 of the “burnout.” f . The slope m sec of this secant line is<br />
limit?<br />
(a) Write Professor f (x) Smith’s − f (c)<br />
m claim symbolically as a limit.<br />
sec = (1)<br />
58. (a) Use a table to investigate lim(5 − 2x). x<br />
x→2 (b) Write Professorx Smith’s − c claim using the ε-δ definition<br />
(b) How close must x be to 2, so that f (x) is within 0.1 of the<br />
of limit.<br />
Figure 4<br />
Figure 7 shows three different points Q 1 , Q 2 , and Q 3 on the graph of f that are<br />
limit?<br />
successively closer to pointSource: P, andSubmitted three associated by the students secantof lines Millikin 1 , University.<br />
2 , and 3 . The closer<br />
(c) How close must x be to 2, so that f (x) isthe within point 0.01 Q is ofto the the point 62. P, The thedefinition closer theofsecant the slope lineof isthe to the tangent tangent line line to the T graph . Theof<br />
line T ,<br />
limit?<br />
the limiting position of these secant lines, is the tangent line to the graph<br />
f (x)<br />
of<br />
− f<br />
(c)<br />
at P.<br />
59. First-Class Mail As of April<br />
y = f (x) at the point (c, f (c)) is m tan = lim<br />
.<br />
y<br />
y<br />
y<br />
x→c<br />
2016, the U.S. Postal Service<br />
x − c<br />
y f (x)<br />
y f (x)<br />
charged $0.47 postage for<br />
Another Secant<br />
y f (x)<br />
way to express this slope is to define a new variable l 1 Secant<br />
first-class letters weighing up to<br />
h = x<br />
line<br />
l2l3 lines<br />
Q (x, f (x)) − c. Rewrite the slope of the tangent line m tan Q 1<br />
using h and c.<br />
and including 1 ounce, plus a flat<br />
63. If f (2) = 6, can you conclude anything about lim f (x)? Explain<br />
fee of $0.21 for each additional l x→2<br />
T<br />
your reasoning.<br />
l Q T<br />
2 l T<br />
Q<br />
or partial ounce up to and<br />
3<br />
Tangent<br />
64. If limTangent<br />
f (x) = 6, can you conclude anything about f (2)? Tangent Explain<br />
including P 3.5 (c, f ounces. (c)) First-class<br />
P (c, f (c)) x→2<br />
P (c, f (c))<br />
line<br />
line<br />
line<br />
letter rates do not apply to letters<br />
your reasoning.<br />
weighing more than 3.5 ounces.<br />
65. The graph of f (x) = x − 3 is a straight line with a point punched<br />
Source: U.S. Postal c Service Notice 123 x<br />
c<br />
3 − x<br />
out. x<br />
x<br />
c x x<br />
3 x 2 x 1<br />
x<br />
Figure (a) 5Find m tan<br />
a = function slope of C the thattangent modelsline.<br />
the first-class postage charged,<br />
Figure 6 m sec = slope of a(a) secant What line. straight line and DF what Figure point? 7<br />
in dollars, for a letter weighing w ounces. Assume w>0.<br />
(b) Use the graph of f to investigate the one-sided limits of f as<br />
(b) What is the domain of C?<br />
If the limiting position of xthe approaches secant lines 3. is the tangent line, then the limit of the<br />
(c) Graph the function C.<br />
slopes of the secant lines should (c) Does equal the graph the slope suggest of the thattangent lim f (x) exists? If so, what is it?<br />
(d) Use the graph to investigate lim C(w) and lim C(w). Do<br />
x→3<br />
line. Notice in Figure 7<br />
w→2− thatw→2 as + the point Q moves closer to the point P, the numbers x get closer to c. So,<br />
66. (a) Use a table to investigate lim(1 + x)<br />
these suggest that lim C(w) exists? equation (1) suggests that<br />
1/x .<br />
x→0<br />
w→2<br />
(e) Use the graph to investigate lim C(w).<br />
m (b) Use graphing technology to graph g(x) = (1 + x) 1/x tan = [Slope of the tangent line to f at P]<br />
.<br />
[<br />
]<br />
Tangent line at P w→0 + (c) What f do (x) (a) −and f (c) (b) suggest about lim(1 + x) 1/x ?<br />
(f) Use the graph to investigate lim C(w).<br />
= Limit of<br />
as x gets closer x→0 to c<br />
w→3.5 − x − c<br />
CAS (d) Find lim(1 + x) 1/x .<br />
x→0<br />
60. First-Class Mail As of April 2016, the U.S. InPostal symbols, Service we write<br />
P<br />
f (x) − f (c)<br />
charged $0.94 postage for first-class large envelope weighing up to<br />
m tan = lim<br />
and including 1 ounce, plus a flat fee of $0.21 for each additional<br />
x→c x − c<br />
or partial ounce up to and including 13 ounces. The First-class notation rates limdois read, Challenge “the limit Problems as x approaches c.”<br />
x→c<br />
not apply to large envelopes weighing more than 13 ounces.<br />
The tangent line to Forthe Problems graph of 67–70, a function investigate f at each a point of theP following = (c, f limits. (c)) is the line<br />
Source: U.S. Postal Service Notice 123<br />
{<br />
containing the point P whose slope is<br />
1 if x is an integer<br />
Kathryn Sidenstricker /Dreamstime.com<br />
f (x) =<br />
(a) Find a function C that models the first-class postage charged,<br />
f (x) − f (c)<br />
in dollars, for a large envelope weighing w ounces. Assume<br />
m tan = lim<br />
w>0.<br />
67. lim f (x) x→c 68. limx −f (x) c 69. lim<br />
x→2 x→1/2 x→3<br />
(b) What is the domain ofSecant<br />
C?<br />
provided the limit exists.<br />
Figure 8<br />
lines<br />
WEB SITE<br />
Mathscoop: The Mathscoop Web site has a<br />
secant and tangent line applet that you may want<br />
to demo in class. You can drag one point of the<br />
secant line to the point of tangency to show the<br />
relationship between the two lines. The applet<br />
allows you to click Play to show the animation<br />
to the students. This can help to show how x<br />
approaches c when demonstrating how the slope<br />
of the secant line approaches that of the tangent<br />
line. A link to this resource is available on the<br />
Additional Chapter 1 Resources document,<br />
available for download.<br />
0 if x is not an integer<br />
f (x) 70. lim<br />
x→0 f (x)<br />
As Figure 8 illustrates, this new idea of a tangent line is consistent with the traditional<br />
definition of a tangent line to a circle.<br />
Teaching Tip<br />
Students should be familiar with finding the slope<br />
of a line given two points. When those two points<br />
fall on the graph of a function, we call the line that<br />
connects them the secant line. The word “secant”<br />
comes from the Latin word secare, meaning to<br />
cut. As the two points that create the secant line<br />
become closer and closer together on the curve,<br />
the slope of the secant line approaches the slope<br />
of the tangent line to the point upon which they are<br />
converging.<br />
common error<br />
Students may think that a tangent line<br />
must only touch the function at one point<br />
and cannot cross or touch the function<br />
at any other point. However, the tangent<br />
line is a localized concept. The tangent<br />
line may intersect the function at another<br />
point on the function. See in the figure that<br />
the graph of y = sin x, with a tangent line<br />
drawn at x = π / 3. This line intersects the<br />
function again in quadrant III.<br />
2π<br />
y<br />
1<br />
21<br />
Tangent line<br />
Teaching Tip<br />
Remind the students of the definition of<br />
slope with which they are familiar when<br />
naming the two points (x 1<br />
, y 1<br />
) and (x 2<br />
, y 2<br />
):<br />
m −<br />
=<br />
y y 2 1<br />
x − x<br />
2 1<br />
Ask the students to compare this to the<br />
formula for the slope of a secant line.<br />
fx ( ) − fc ()<br />
msec<br />
=<br />
x−<br />
c<br />
The only difference between these two<br />
formulas is the way the two points are<br />
named. In this case, the points are named<br />
(c,f(c)) and (c,f(x)).<br />
Then, point out that as the two points get<br />
closer and closer together (as x approaches<br />
c), the slope of the secant line approaches<br />
the slope of the tangent line. Hence the<br />
formula:<br />
fx fc<br />
m lim ( ) − ()<br />
x c<br />
.<br />
tan =<br />
x→c<br />
−<br />
Teaching Tip<br />
The word “tangent” comes from the Latin<br />
tangere, meaning to touch. Students may<br />
be familiar with the term “tangent line” from<br />
their geometry course, where they learned<br />
that a line that touches a circle at just one<br />
point is tangent to the circle. Let them know<br />
that a tangent line can be found for any<br />
function, not just circles.<br />
π<br />
x<br />
Section 1.1 • Limits of Functions Using Numerical and Graphical Techniques 79<br />
TE_<strong>Sullivan</strong>_Chapter01_PART 0.indd 8<br />
11/01/17 9:51 am