<strong>EDC</strong> <strong>2014</strong> Performance Report Financial information on the operating segments are summarized as follows: LGBU NIGBU BGBU MAGBU Pantabangan/ Masiway WINBU Others Total Year ended December 31, <strong>2014</strong> Segment revenue ₱18,364,197,709 ₱12,644,433,901 ₱4,494,754,347 ₱2,368,843,658 ₱1,624,130,409 ₱188,304,621 ₱8,337,288 ₱39,693,001,933 Intersegment revenue (2,779,106,429) (4,588,402,375) (1,458,293,212) – – – – (8,825,802,016) Total segment revenue 15,585,091,280 8,056,031,526 3,036,461,135 2,368,843,658 1,624,130,409 188,304,621 8,337,288 30,867,199,917 Segment expenses (7,979,398,782) (3,372,114,185) (2,341,764,411) (1,801,952,981) (918,884,082) (177,902,756) (16,592,017,197) Unallocated expenses (466,664,177) (466,664,177) Interest income 85,281,147 42,110,150 17,277,300 11,065,979 28,421,845 533,136 2,098 184,691,655 Interest expense (1,724,439,558) (907,465,848) (458,834,430) (348,769,365) (172,264,865) (89,174,965) (53,061,691) (3,754,010,722) Other income (expenses) - net 356,025,843 108,560,848 (39,774,107) 24,558,255 (3,256,276) (463,470) 303,844,218 749,495,311 Income taxes (639,569,890) (602,584,327) 57,316,899 (11,388,706) (18,074,121) (2,646,292) (5,642,964) (1,222,589,401) Reversal of previously impaired property, plant and equipment – 2,051,903,642 – – – – – 2,051,903,642 Segment result ₱5,682,990,040 ₱5,376,441,806 ₱270,682,386 ₱242,356,840 ₱540,072,910 (₱81,349,726) (₱213,185,228) ₱11,818,009,028 EBITDA ₱9,604,617,446 ₱5,399,587,225 ₱1,119,322,968 ₱941,278,769 ₱1,126,806,226 ₱150,943,432 ₱8,337,288 ₱18,350,893,354 Unallocated Expenses – – – – – – – (428,788,398) ₱17,922,104,956 LGBU NIGBU BGBU MAGBU Pantabangan/ Masiway WINBU Others Total Year ended December 31, 2013 Segment revenue ₱15,775,292,990 ₱11,182,135,164 ₱246,465,088 ₱1,876,973,704 ₱2,501,216,675 ₱– ₱– ₱31,582,083,621 Intersegment revenue (1,888,584,019) (3,980,653,002) (56,576,130) – – – – (5,925,813,151) Total segment revenue 13,886,708,971 7,201,482,162 189,888,958 1,876,973,704 2,501,216,675 – – 25,656,270,470 Segment expenses (7,100,076,840) (2,775,764,935) (1,110,547,292) (1,449,321,408) (855,065,032) (28,496,170) – (13,319,271,677) Unallocated expenses – – – – – – (448,271,495) (448,271,495) Interest income 150,817,865 63,342,356 34,991,681 18,269,183 26,493,820 125,529 6,932 294,047,366 Interest expense (1,663,184,605) (847,376,565) (342,418,566) (337,619,061) (187,577,900) – (6,322,607) (3,384,499,304) Other expenses - net (1,252,587,196) (587,531,051) (145,772,169) (90,238,985) (9,392,222) (14,796,010) (583,904,541) (2,684,222,174) Income taxes (400,449,803) (269,436,691) 183,217,106 12,600,066 (8,868,213) – (3,045,814) (485,983,349) Segment result ₱3,621,228,392 ₱2,784,715,276 (₱1,190,640,282) ₱30,663,499 ₱1,466,807,128 (₱43,166,651) (₱1,041,537,525) ₱5,628,069,837 EBITDA ₱8,870,163,861 ₱5,008,022,338 (₱639,659,175) ₱792,428,490 ₱2,067,053,408 (₱27,414,558) ₱– ₱16,070,594,364 Unallocated Expenses – – – – – – – (429,519,371) ₱15,641,074,993 LGBU NIGBU BGBU MAGBU Pantabangan/ Masiway WINBU Others Total Year ended December 31, 2012 Segment revenue ₱16,190,546,266 ₱11,088,763,078 ₱– ₱1,985,626,185 ₱4,753,254,746 ₱– ₱– ₱34,018,190,275 Intersegment revenue (1,712,199,749) (3,937,438,471) – – – – – (5,649,638,220) Total segment revenue 14,478,346,517 7,151,324,607 – 1,985,626,185 4,753,254,746 – – 28,368,552,055 Segment expenses (7,294,571,578) (2,838,804,166) (1,852,026,768) (1,384,452,380) (932,300,338) (1,720,304) – (14,303,875,534) Unallocated expenses – – – – – – (223,274,415) (223,274,415) Interest income 185,725,002 59,809,514 41,322,195 24,420,316 53,302,912 39,987 21,063 364,640,989 Interest expense (1,709,768,641) (885,978,756) (344,252,976) (350,508,951) (413,139,145) – – (3,703,648,469) Other income (expenses) - net 365,373,277 502,892,471 55,674,459 22,890,728 (74,734,305) 476,331 19,180,134 891,753,095 Income taxes (570,412,575) (383,138,659) 164,610,199 (15,268,508) 12,207,962 – 16,878,987 (775,122,594) Segment result from continuing operations ₱5,454,692,002 ₱3,606,105,011 (₱1,934,672,891) ₱282,707,390 ₱3,398,591,832 (₱1,203,986) (₱187,194,231) ₱10,619,025,127 EBITDA ₱9,261,002,063 ₱4,899,116,507 (₱1,588,897,178) ₱935,603,693 ₱4,241,171,029 (₱1,720,305) ₱– ₱17,746,275,809 Unallocated Expenses – – – – – – – (194,433,529) ₱17,551,842,280 190
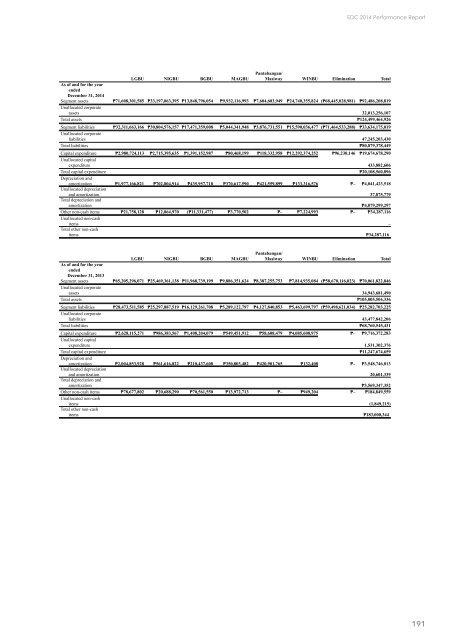
<strong>EDC</strong> <strong>2014</strong> Performance Report LGBU NIGBU BGBU MAGBU Pantabangan/ Masiway WINBU Elimination Total As of and for the year ended December 31, <strong>2014</strong> Segment assets ₱71,608,301,585 ₱33,197,063,395 ₱13,848,796,054 ₱9,932,116,993 ₱7,604,603,949 ₱24,740,355,824 (₱68,445,028,981) ₱92,486,208,819 Unallocated corporate assets 32,013,256,107 Total assets ₱124,499,464,926 Segment liabilities ₱32,311,663,166 ₱30,804,576,157 ₱17,471,359,008 ₱5,044,341,948 ₱3,876,731,551 ₱15,590,036,477 (₱71,464,533,288) ₱33,634,175,019 Unallocated corporate liabilities 47,245,203,430 Total liabilities ₱80,879,378,449 Capital expenditure ₱2,980,724,113 ₱2,715,395,635 ₱1,391,152,987 ₱80,468,199 ₱118,332,958 ₱12,292,374,252 ₱96,230,146 ₱19,674,678,290 Unallocated capital expenditure 433,882,606 Total capital expenditure ₱20,108,560,896 Depreciation and amortization ₱1,977,166,821 ₱702,804,914 ₱435,957,718 ₱370,617,590 ₱421,559,899 ₱133,316,576 ₱– ₱4,041,423,518 Unallocated depreciation and amortization 37,875,779 Total depreciation and amortization ₱4,079,299,297 Other non-cash items ₱21,758,128 ₱12,864,970 (₱11,331,477) ₱3,770,502 ₱– ₱7,224,993 ₱– ₱34,287,116 Unallocated non-cash items – Total other non-cash items ₱34,287,116 LGBU NIGBU BGBU MAGBU Pantabangan/ Masiway WINBU Elimination Total As of and for the year ended December 31, 2013 Segment assets ₱65,205,296,071 ₱25,469,361,138 ₱11,968,739,199 ₱9,886,351,624 ₱8,387,255,753 ₱7,814,935,084 (₱58,670,116,023) ₱70,061,822,846 Unallocated corporate assets 34,943,681,490 Total assets ₱105,005,504,336 Segment liabilities ₱28,473,511,585 ₱25,297,887,519 ₱16,129,261,708 ₱5,289,122,797 ₱4,127,840,853 ₱5,463,699,797 (₱59,498,621,034) ₱25,282,703,225 Unallocated corporate liabilities 43,477,842,206 Total liabilities ₱68,760,545,431 Capital expenditure ₱2,628,115,271 ₱986,383,567 ₱1,408,204,079 ₱549,451,912 ₱58,608,479 ₱4,085,608,975 ₱– ₱9,716,372,283 Unallocated capital expenditure 1,531,302,376 Total capital expenditure ₱11,247,674,659 Depreciation and amortization ₱2,004,853,928 ₱561,616,822 ₱210,437,608 ₱350,803,482 ₱420,901,765 ₱132,408 ₱– ₱3,548,746,013 Unallocated depreciation and amortization 20,601,339 Total depreciation and amortization ₱3,569,347,352 Other non-cash items ₱78,677,802 ₱20,688,290 ₱70,561,550 ₱13,972,713 ₱– ₱949,204 ₱– ₱184,849,559 Unallocated non-cash items (1,849,215) Total other non-cash items ₱183,000,344 191