EDC 2014 SR (UPDATED)

Create successful ePaper yourself
Turn your PDF publications into a flip-book with our unique Google optimized e-Paper software.
<strong>EDC</strong> <strong>2014</strong> Performance Report<br />
Japanese<br />
yen (JP¥)<br />
Sweden<br />
kroner<br />
(SEK<br />
Original Currency<br />
Chilean<br />
Peso<br />
(CH₱)<br />
Peruvian<br />
Sol<br />
(PEN)<br />
<strong>2014</strong><br />
Singapore<br />
Dollar (SGD)<br />
New Zealand<br />
dollar (NZD)<br />
Peso<br />
Equivalent1<br />
US$<br />
Financial Liabilities<br />
Liabilities at amortized<br />
cost:<br />
Accounts payable 18,288,738 117,481,739 1,569,250 − − 94,100 259,616 ₱882,590,091<br />
Long-term debt 661,843,245 − − − − − − 29,597,629,916<br />
Accrued interest on<br />
long-term debts 9,021,799 − − − − − − 403,454,851<br />
Derivative liability 3,795,503 − − − − − − 169,734,894<br />
Total financial liabilities 692,949,285 117,481,739 1,569,250 − − 94,100 259,616 ₱31,053,409,752<br />
1<br />
US$1= ₱44.72, JP¥1=₱0.371444,SEK1=₱5.686, CH₱1=₱0.073837, PEN1=₱14.959, SGD1=₱33.6961 and NZD1=₱34.6136<br />
as of December 31, <strong>2014</strong> (see Note 25)<br />
Japanese<br />
yen (JP¥)<br />
Sweden<br />
kroner<br />
(SEK<br />
Original Currency<br />
Chilean<br />
Peso<br />
(CH₱)<br />
Peruvian<br />
Sol<br />
(PEN)<br />
2013<br />
Singapore<br />
Dollar (SGD)<br />
New Zealand<br />
dollar (NZD)<br />
Peso<br />
Equivalent1<br />
US$<br />
Financial Assets<br />
Loans and receivables:<br />
Cash equivalents 56,300,000 − − − − − − ₱2,499,438,500<br />
Cash on hand and in<br />
banks 11,917,441 − − − 96,005,271 − − 537,186,567<br />
AFS investments:<br />
Debt investments 7,696,268 − − − − − − 341,675,818<br />
Financial assets at FVPL:<br />
Derivative assets 169,997 − − − − − − 7,547,020<br />
Derivative assets<br />
designated as cash flow<br />
hedges 1,206,962 − − − − − − 53,583,080<br />
Total financial assets 77,290,668 − − − 96,005,271 − − ₱3,439,430,985<br />
Financial Liabilities<br />
Liabilities at amortized<br />
cost:<br />
Accounts payable 26,621,867 13,822,941 138,000 1,254,342 − 139,000 621,331 ₱1,231,408,505<br />
Long-term debt 513,785,044 − − − − − − 22,809,487,028<br />
Accrued interest on<br />
long-term debts 8,891,194 − − − − − − 394,724,558<br />
Derivative assets<br />
designated as cash<br />
flow hedges 94,568 − − − − − − 4,198,322<br />
Total financial liabilities 549,392,673 13,822,941 138,000 1,254,342 − 139,000 621,331 ₱24,439,818,413<br />
1<br />
US$1= ₱44.395, JP¥1=₱0.0095, GBP1=₱72.90, SEK1=₱6.79, CH₱=1=₱0.08449, EUR1=₱60.82 and NZD1=₱36.212<br />
as of December 31, 2013 .(see Note 25)<br />
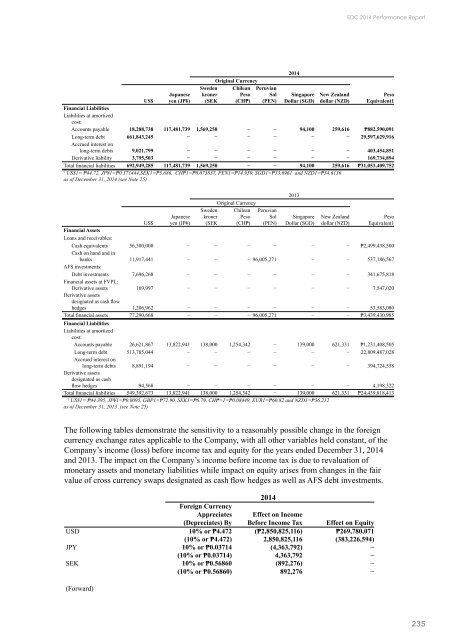
The following tables demonstrate the sensitivity to a reasonably possible change in the foreign<br />
currency exchange rates applicable to the Company, with all other variables held constant, of the<br />
Company’s income (loss) before income tax and equity for the years ended December 31, <strong>2014</strong><br />
and 2013. The impact on the Company’s income before income tax is due to revaluation of<br />
monetary assets and monetary liabilities while impact on equity arises from changes in the fair<br />
value of cross currency swaps designated as cash flow hedges as well as AFS debt investments.<br />
<strong>2014</strong><br />
Foreign Currency<br />
Appreciates<br />
(Depreciates) By<br />
Effect on Income<br />
Before Income Tax Effect on Equity<br />
USD 10% or ₱4.472 (₱2,850,825,116) ₱269,780,071<br />
(10% or ₱4.472) 2,850,825,116 (383,226,594)<br />
JPY 10% or ₱0.03714 (4,363,792) −<br />
(10% or ₱0.03714) 4,363,792 −<br />
SEK 10% or ₱0.56860 (892,276) −<br />
(10% or ₱0.56860) 892,276 −<br />
(Forward)<br />
235