<strong>EDC</strong> <strong>2014</strong> Performance Report The tables below summarize the maturity analysis of the Company’s financial liabilities as of December 31, <strong>2014</strong> and 2013 based on contractual undiscounted payments: <strong>2014</strong> On Demand Less than 3 Months 3 to 6 Months >6 to 12 Months >1 to 5 Years More than 5 Years Total (In Thousand Pesos) Liabilities at amortized cost: Accounts payable* ₱– ₱5,681,577 ₱– ₱– ₱– ₱– ₱5,681,577 Accrued interest on long-term debts 67,918 433,955 298,446 − − − 800,319 Other payables** 67 24,641 − − − − 24,708 Due to related parties 49,625 − − − − − 49,625 Long-term debts − 740,588 10,768,198 2,961,457 29,128,089 49,487,899 93,086,231 Derivative liabilities designated as cash flow hedges − − − − − 169,735 169,735 Total ₱117,610 ₱6,880,761 ₱11,066,644 ₱2,961,457 ₱29,128,089 ₱49,657,634 ₱99,812,195 *excluding statutory liabilities to the Government **excluding non-financial liabilities. 2013 On Demand Less than 3 Months 3 to 6 Months >6 to 12 Months >1 to 5 Years More than 5 Years Total (In Thousand Pesos) Liabilities at amortized cost: Accounts payable* ₱– ₱5,351,131 ₱– ₱– ₱– ₱– ₱5,351,131 Accrued interest on long-term debts 84,356 394,725 313,605 − − − 792,686 Other payables** − 56,563 − − − − 56,563 Due to related parties 53,347 − − − − − 53,347 Royalty payable 39,671 − − − − − 39,671 Long-term debts − 87,278 2,162,178 2,371,072 36,429,373 36,743,861 77,793,762 Derivative liabilities designated as cash flow hedges − 525 − − 3,673 − 4,198 Total ₱177,374 ₱5,890,222 ₱2,475,783 ₱2,371,072 ₱36,433,046 ₱36,743,861 ₱84,091,358 *excluding statutory liabilities to the Government **excluding non-financial liabilities. Financial Assets and Financial Liabilities Set out below is a comparison of carrying amounts and fair values of the Company’s financial instruments as of December 31, <strong>2014</strong> and 2013. <strong>2014</strong> 2013 Carrying Amounts Fair Values Carrying Amounts Fair Values Financial Assets Loans and receivables: Long-term receivables ₱85,753,718 ₱80,742,027 ₱88,962,765 ₱84,641,685 AFS investments: Debt investments 259,846,955 259,846,955 341,841,500 341,841,500 Equity investments 308,129,936 308,129,936 407,242,129 407,242,129 Financial assets at FVPL 523,593,442 523,593,442 − − Derivative assets 7,547,021 7,547,021 Derivative assets designated as cash flow hedge 154,169,144 154,169,144 53,583,080 53,583,080 ₱1,331,493,195 ₱1,326,481,504 ₱899,176,495 ₱894,855,415 (Forward) 240
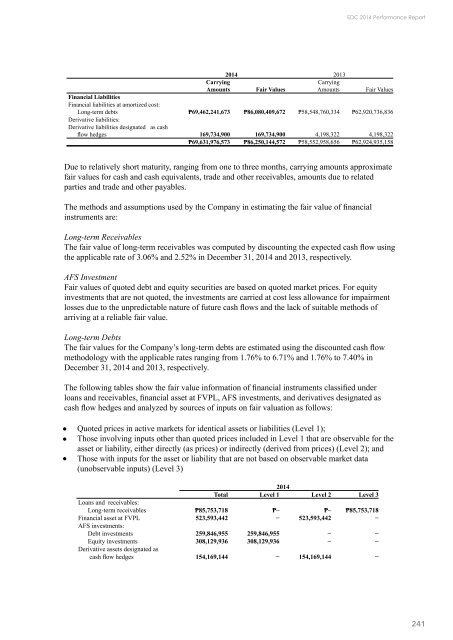
<strong>EDC</strong> <strong>2014</strong> Performance Report <strong>2014</strong> 2013 Carrying Amounts Fair Values Carrying Amounts Fair Values Financial Liabilities Financial liabilities at amortized cost: Long-term debts ₱69,462,241,673 ₱86,080,409,672 ₱58,548,760,334 ₱62,920,736,836 Derivative liabilities: Derivative liabilities designated as cash flow hedges 169,734,900 169,734,900 4,198,322 4,198,322 ₱69,631,976,573 ₱86,250,144,572 ₱58,552,958,656 ₱62,924,935,158 Due to relatively short maturity, ranging from one to three months, carrying amounts approximate fair values for cash and cash equivalents, trade and other receivables, amounts due to related parties and trade and other payables. The methods and assumptions used by the Company in estimating the fair value of financial instruments are: Long-term Receivables The fair value of long-term receivables was computed by discounting the expected cash flow using the applicable rate of 3.06% and 2.52% in December 31, <strong>2014</strong> and 2013, respectively. AFS Investment Fair values of quoted debt and equity securities are based on quoted market prices. For equity investments that are not quoted, the investments are carried at cost less allowance for impairment losses due to the unpredictable nature of future cash flows and the lack of suitable methods of arriving at a reliable fair value. Long-term Debts The fair values for the Company’s long-term debts are estimated using the discounted cash flow methodology with the applicable rates ranging from 1.76% to 6.71% and 1.76% to 7.40% in December 31, <strong>2014</strong> and 2013, respectively. The following tables show the fair value information of financial instruments classified under loans and receivables, financial asset at FVPL, AFS investments, and derivatives designated as cash flow hedges and analyzed by sources of inputs on fair valuation as follows: Quoted prices in active markets for identical assets or liabilities (Level 1); Those involving inputs other than quoted prices included in Level 1 that are observable for the asset or liability, either directly (as prices) or indirectly (derived from prices) (Level 2); and Those with inputs for the asset or liability that are not based on observable market data (unobservable inputs) (Level 3) <strong>2014</strong> Total Level 1 Level 2 Level 3 Loans and receivables: Long-term receivables ₱85,753,718 ₱– ₱– ₱85,753,718 Financial asset at FVPL 523,593,442 − 523,593,442 − AFS investments: Debt investments 259,846,955 259,846,955 − − Equity investments 308,129,936 308,129,936 − − Derivative assets designated as cash flow hedges 154,169,144 − 154,169,144 − 241
- Page 4 and 5:
EDC 2014 Performance Report EDC AT
- Page 6:
EDC 2014 Performance Report This pa
- Page 10 and 11:
EDC 2014 Performance Report ABOUT T
- Page 12 and 13:
EDC 2014 Performance Report The Lop
- Page 14 and 15:
EDC 2014 Performance Report LETTER
- Page 16 and 17:
EDC 2014 Performance Report 250kph,
- Page 18 and 19:
EDC 2014 Performance Report Report
- Page 20 and 21:
EDC 2014 Performance Report 2 RECOR
- Page 22 and 23:
EDC 2014 Performance Report EDC has
- Page 24 and 25:
EDC 2014 Performance Report our emp
- Page 26 and 27:
EDC 2014 Performance Report Kokoy V
- Page 28 and 29:
EDC 2014 Performance Report Report
- Page 30 and 31:
EDC 2014 Performance Report by ₱0
- Page 32 and 33:
EDC 2014 Performance Report INVESTO
- Page 34 and 35:
EDC 2014 Performance Report Oversea
- Page 37 and 38:
As EDC’s business evolves from st
- Page 39 and 40:
EDC 2014 Performance Report Phase 2
- Page 41:
EDC 2014 Performance Report FEATURE
- Page 44 and 45:
EDC 2014 Performance Report EDC con
- Page 46 and 47:
EDC 2014 Performance Report FEATURE
- Page 48 and 49:
EDC 2014 Performance Report Enterin
- Page 50 and 51:
EDC 2014 Performance Report FEATURE
- Page 52 and 53:
EDC 2014 Performance Report 52
- Page 54 and 55:
EDC 2014 Performance Report Energy
- Page 56 and 57:
EDC 2014 Performance Report GHG emi
- Page 58 and 59:
EDC 2014 Performance Report geother
- Page 60 and 61:
EDC 2014 Performance Report convent
- Page 62 and 63:
EDC 2014 Performance Report Our Fed
- Page 64 and 65:
EDC 2014 Performance Report FEATURE
- Page 66 and 67:
EDC 2014 Performance Report EDC pla
- Page 69 and 70:
Critical to the transformation of E
- Page 71 and 72:
EDC 2014 Performance Report Total n
- Page 73 and 74:
EDC 2014 Performance Report to prod
- Page 75:
EDC 2014 Performance Report PEOPLE
- Page 78 and 79:
EDC 2014 Performance Report The Hea
- Page 80 and 81:
EDC 2014 Performance Report “EDC
- Page 82 and 83:
EDC 2014 Performance Report were al
- Page 84 and 85:
EDC 2014 Performance Report We ackn
- Page 86 and 87:
EDC 2014 Performance Report B. The
- Page 88 and 89:
EDC 2014 Performance Report (UPCAT)
- Page 90 and 91:
EDC 2014 Performance Report c) d) e
- Page 92 and 93:
EDC 2014 Performance Report Positio
- Page 94 and 95:
EDC 2014 Performance Report Board M
- Page 96 and 97:
EDC 2014 Performance Report • Ass
- Page 98 and 99:
EDC 2014 Performance Report Board O
- Page 100 and 101:
EDC 2014 Performance Report Compens
- Page 105 and 106:
EDC 2014 Performance Report 1 OSCAR
- Page 107 and 108:
EDC 2014 Performance Report conceiv
- Page 109 and 110:
Manuel S. OGENA Head - Geosciences
- Page 111 and 112:
EDC 2014 Performance Report nestor
- Page 113 and 114:
EDC 2014 Performance Report Mr. Max
- Page 115 and 116:
EDC 2014 Performance Report A Passi
- Page 117 and 118:
EDC 2014 Performance Report and con
- Page 119 and 120:
EDC 2014 Performance Report DR. ATT
- Page 121 and 122:
EDC 2014 Performance Report General
- Page 123 and 124:
EDC 2014 Performance Report SPECIFI
- Page 125 and 126:
EDC 2014 Performance Report SPECIFI
- Page 127 and 128:
EDC 2014 Performance Report 2014 AU
- Page 129 and 130:
EDC 2014 Performance Report • We
- Page 131 and 132:
EDC 2014 Performance Report 131
- Page 133 and 134:
EDC 2014 Performance Report Opinion
- Page 135 and 136:
EDC 2014 Performance Report Decembe
- Page 137 and 138:
EDC 2014 Performance Report ENERGY
- Page 139 and 140:
EDC 2014 Performance Report Equity
- Page 141 and 142:
EDC 2014 Performance Report ENERGY
- Page 143 and 144:
EDC 2014 Performance Report ENERGY
- Page 145 and 146:
EDC 2014 Performance Report Percent
- Page 147 and 148:
EDC 2014 Performance Report ULGPPs,
- Page 149 and 150:
EDC 2014 Performance Report EBSEHI
- Page 151 and 152:
EDC 2014 Performance Report This in
- Page 153 and 154:
EDC 2014 Performance Report Both HR
- Page 155 and 156:
EDC 2014 Performance Report managem
- Page 157 and 158:
EDC 2014 Performance Report These n
- Page 159 and 160:
EDC 2014 Performance Report decisio
- Page 161 and 162:
EDC 2014 Performance Report 4. Summ
- Page 163 and 164:
EDC 2014 Performance Report Non-mon
- Page 165 and 166:
EDC 2014 Performance Report Depreci
- Page 167 and 168:
EDC 2014 Performance Report rights
- Page 169 and 170:
EDC 2014 Performance Report HTM Inv
- Page 171 and 172:
EDC 2014 Performance Report “Day
- Page 173 and 174:
EDC 2014 Performance Report Assets
- Page 175 and 176:
EDC 2014 Performance Report Defined
- Page 177 and 178:
EDC 2014 Performance Report Direct
- Page 179 and 180:
EDC 2014 Performance Report Costs o
- Page 181 and 182:
EDC 2014 Performance Report Operati
- Page 183 and 184:
EDC 2014 Performance Report PFRS 3,
- Page 185 and 186:
EDC 2014 Performance Report electin
- Page 187 and 188:
EDC 2014 Performance Report Effecti
- Page 189 and 190: EDC 2014 Performance Report 6. Oper
- Page 191 and 192: EDC 2014 Performance Report LGBU NI
- Page 193 and 194: EDC 2014 Performance Report 7. Cash
- Page 195 and 196: EDC 2014 Performance Report The mov
- Page 197 and 198: EDC 2014 Performance Report 12. Pro
- Page 199 and 200: EDC 2014 Performance Report On Nove
- Page 201 and 202: EDC 2014 Performance Report In Dece
- Page 203 and 204: EDC 2014 Performance Report 2013 Ot
- Page 205 and 206: EDC 2014 Performance Report 14. Exp
- Page 207 and 208: EDC 2014 Performance Report Allowan
- Page 209 and 210: EDC 2014 Performance Report The Com
- Page 211 and 212: EDC 2014 Performance Report IFC The
- Page 213 and 214: EDC 2014 Performance Report With th
- Page 215 and 216: EDC 2014 Performance Report iv. v.
- Page 217 and 218: EDC 2014 Performance Report On May
- Page 219 and 220: EDC 2014 Performance Report The pur
- Page 221 and 222: EDC 2014 Performance Report 21. Cos
- Page 223 and 224: EDC 2014 Performance Report Interes
- Page 225 and 226: EDC 2014 Performance Report 2014 20
- Page 227 and 228: EDC 2014 Performance Report The Com
- Page 229 and 230: EDC 2014 Performance Report 2013 Be
- Page 231 and 232: EDC 2014 Performance Report Any tax
- Page 233 and 234: EDC 2014 Performance Report With re
- Page 235 and 236: EDC 2014 Performance Report Japanes
- Page 237 and 238: EDC 2014 Performance Report Interes
- Page 239: EDC 2014 Performance Report Liquidi
- Page 243 and 244: EDC 2014 Performance Report 2013 De
- Page 245 and 246: EDC 2014 Performance Report The Com
- Page 247 and 248: EDC 2014 Performance Report Pertine
- Page 249 and 250: EDC 2014 Performance Report As of D
- Page 251 and 252: EDC 2014 Performance Report Sorsogo
- Page 253 and 254: EDC 2014 Performance Report minimum
- Page 255 and 256: EDC 2014 Performance Report On May
- Page 257 and 258: EDC 2014 Performance Report Operati
- Page 259 and 260: EDC 2014 Performance Report 41. Not
- Page 261 and 262: EDC 2014 Performance Report Corpora