EDC 2014 SR (UPDATED)

Create successful ePaper yourself
Turn your PDF publications into a flip-book with our unique Google optimized e-Paper software.
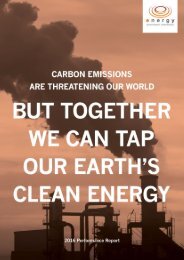
<strong>EDC</strong> <strong>2014</strong> Performance Report<br />
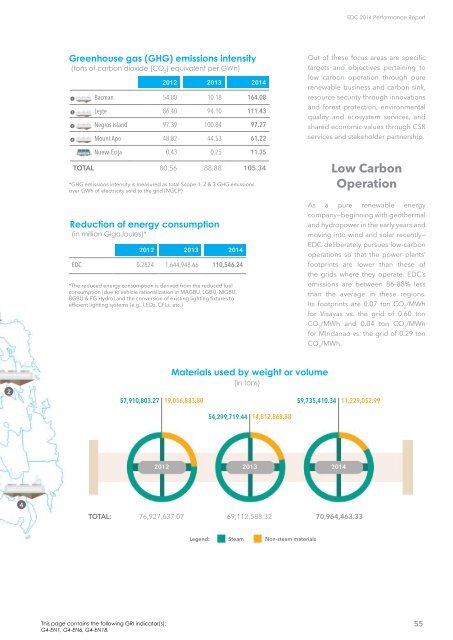
Greenhouse gas (GHG) emissions intensity<br />
(tons of carbon dioxide [CO 2<br />
] equivalent per GWh)<br />
1<br />
2<br />
3<br />
4<br />
2012 2013 <strong>2014</strong><br />
Bacman 54.80 10.18 164.08<br />
Leyte 86.40 94.10 111.43<br />
Negros Island 97.39 100.84 97.27<br />
Mount Apo 48.82 44.53 61.22<br />
Nueva Ecija 0.43 0.25 11.35<br />
TOTAL 80.56 88.88 105.34<br />
*GHG emissions intensity is measured as total Scope 1, 2 & 3 GHG emissions<br />
over GWh of electricity sold to the grid (NGCP)<br />
Reduction of energy consumption<br />
(in million GigaJoules)*<br />
2012 2013 <strong>2014</strong><br />
<strong>EDC</strong> 0.2824 1,644,948.66 110,546.24<br />
*The reduced energy consumption is derived from the reduced fuel<br />
consumption (due to vehicle rationalization in MAGBU, LGBU, NIGBU,<br />
BGBU & FG Hydro) and the conversion of existing lighting fixtures to<br />
efficient lighting systems (e.g., LEDs, CFLs, etc.)<br />
Out of these focus areas are specific<br />
targets and objectives pertaining to<br />
low carbon operation through pure<br />
renewable business and carbon sink,<br />
resource security through innovations<br />
and forest protection, environmental<br />
quality and ecosystem services, and<br />
shared economic values through C<strong>SR</strong><br />
services and stakeholder partnership.<br />
Low Carbon<br />
Operation<br />
As a pure renewable energy<br />
company—beginning with geothermal<br />
and hydropower in the early years and<br />
moving into wind and solar recently—<br />
<strong>EDC</strong> deliberately pursues low-carbon<br />
operations so that the power plants’<br />
footprints are lower than these of<br />
the grids where they operate. <strong>EDC</strong>’s<br />
emissions are between 86–88% less<br />
than the average in these regions.<br />
Its footprints are 0.07 ton CO 2<br />
/MWh<br />
for Visayas vs. the grid of 0.60 ton<br />
CO 2<br />
/MWh and 0.04 ton CO 2<br />
/MWh<br />
for Mindanao vs. the grid of 0.29 ton<br />
CO 2<br />
/MWh.<br />
2<br />
Materials used by weight or volume<br />
(in tons)<br />
57,910,803.27 19,016,833.80 59,735,410.34 11,229,052.99<br />
54,299,719.44<br />
14,812,868.88<br />
2012 2013 <strong>2014</strong><br />
4<br />
TOTAL:<br />
76,927,637.07 69,112,588.32 70,964,463.33<br />
Legend: Steam Non-steam materials<br />
This page contains the following GRI indicator(s):<br />
G4-EN1, G4-EN6, G4-EN18.<br />
55