- Page 1 and 2:
www.it-ebooks.info
- Page 3 and 4:
Facebook ® Marketing FOR DUMmIES
- Page 5 and 6:
About the Authors Paul Dunay has sp
- Page 7 and 8:
Dedication We dedicate this book to
- Page 9 and 10:
Contents at a Glance Introduction .
- Page 11 and 12:
Table of Contents Introduction ....
- Page 13 and 14:
Table of Contents xi Applying Your
- Page 15 and 16:
Table of Contents xiii Viewing Face
- Page 17 and 18:
Table of Contents xv Chapter 18: Te
- Page 19 and 20:
Introduction With more than 200 mil
- Page 21 and 22:
Introduction 3 ✓ If you have a Pa
- Page 23 and 24:
Introduction 5 This icon points out
- Page 25 and 26:
Part I Getting Started on Facebook
- Page 27 and 28:
Chapter 1 Introducing Facebook Mark
- Page 29 and 30:
Chapter 1: Introducing Facebook Mar
- Page 31 and 32:
Chapter 1: Introducing Facebook Mar
- Page 33 and 34:
Chapter 1: Introducing Facebook Mar
- Page 35 and 36:
Chapter 1: Introducing Facebook Mar
- Page 37 and 38:
Chapter 1: Introducing Facebook Mar
- Page 39 and 40:
Chapter 2 Joining the Facebook Comm
- Page 41 and 42:
Chapter 2: Joining the Facebook Com
- Page 43 and 44:
Chapter 2: Joining the Facebook Com
- Page 45 and 46:
Chapter 2: Joining the Facebook Com
- Page 47 and 48:
Chapter 2: Joining the Facebook Com
- Page 49 and 50:
Chapter 2: Joining the Facebook Com
- Page 51 and 52:
Chapter 2: Joining the Facebook Com
- Page 53 and 54:
Chapter 3 Finding Your Way Around I
- Page 55 and 56:
Chapter 3: Finding Your Way Around
- Page 57 and 58:
Chapter 3: Finding Your Way Around
- Page 59 and 60:
Chapter 3: Finding Your Way Around
- Page 61 and 62:
Chapter 3: Finding Your Way Around
- Page 63 and 64:
Chapter 3: Finding Your Way Around
- Page 65 and 66:
Chapter 3: Finding Your Way Around
- Page 67 and 68:
Chapter 3: Finding Your Way Around
- Page 69 and 70:
Chapter 3: Finding Your Way Around
- Page 71 and 72:
Part II Putting Facebook to Work ww
- Page 73 and 74:
Chapter 4 Creating a Page for Your
- Page 75 and 76:
Chapter 4: Creating a Page for Your
- Page 77 and 78:
Chapter 4: Creating a Page for Your
- Page 79 and 80:
Chapter 4: Creating a Page for Your
- Page 81 and 82:
Chapter 4: Creating a Page for Your
- Page 83 and 84:
Chapter 4: Creating a Page for Your
- Page 85 and 86:
Chapter 4: Creating a Page for Your
- Page 87 and 88:
Chapter 4: Creating a Page for Your
- Page 89 and 90:
Finding Fans for Your Page Chapter
- Page 91 and 92:
Chapter 4: Creating a Page for Your
- Page 93 and 94:
Chapter 4: Creating a Page for Your
- Page 95 and 96:
Chapter 5 Developing a Facebook Mar
- Page 97 and 98:
Chapter 5: Developing a Facebook Ma
- Page 99 and 100:
Chapter 5: Developing a Facebook Ma
- Page 101 and 102:
Chapter 5: Developing a Facebook Ma
- Page 103 and 104:
Chapter 5: Developing a Facebook Ma
- Page 105 and 106:
Chapter 5: Developing a Facebook Ma
- Page 107 and 108:
Chapter 5: Developing a Facebook Ma
- Page 109 and 110:
Chapter 5: Developing a Facebook Ma
- Page 111 and 112:
Chapter 6 Promoting Your Page In Th
- Page 113 and 114:
Chapter 6: Promoting Your Page 95 Y
- Page 115 and 116:
Chapter 6: Promoting Your Page 97 U
- Page 117 and 118:
Chapter 6: Promoting Your Page 99 A
- Page 119 and 120:
Chapter 6: Promoting Your Page 101
- Page 121 and 122:
Chapter 6: Promoting Your Page 103
- Page 123 and 124:
Chapter 6: Promoting Your Page 105
- Page 125 and 126:
Chapter 6: Promoting Your Page 107
- Page 127 and 128:
Chapter 6: Promoting Your Page Leve
- Page 129 and 130:
Chapter 6: Promoting Your Page 111
- Page 131 and 132:
Chapter 6: Promoting Your Page 113
- Page 133 and 134:
Chapter 6: Promoting Your Page 115
- Page 135 and 136:
Chapter 7 Facing Facebook Groups In
- Page 137 and 138:
Chapter 7: Facing Facebook Groups 1
- Page 139 and 140:
Chapter 7: Facing Facebook Groups 1
- Page 141 and 142: Chapter 7: Facing Facebook Groups 1
- Page 143 and 144: Chapter 7: Facing Facebook Groups 1
- Page 145 and 146: Chapter 7: Facing Facebook Groups 1
- Page 147 and 148: Chapter 7: Facing Facebook Groups 1
- Page 149 and 150: Chapter 7: Facing Facebook Groups 1
- Page 151 and 152: Chapter 8 Hosting Facebook Events I
- Page 153 and 154: Chapter 8: Hosting Facebook Events
- Page 155 and 156: Chapter 8: Hosting Facebook Events
- Page 157 and 158: Chapter 8: Hosting Facebook Events
- Page 159 and 160: Chapter 8: Hosting Facebook Events
- Page 161 and 162: Chapter 8: Hosting Facebook Events
- Page 163 and 164: Chapter 8: Hosting Facebook Events
- Page 165 and 166: Chapter 8: Hosting Facebook Events
- Page 167 and 168: Chapter 8: Hosting Facebook Events
- Page 169 and 170: Part III Strategies for Advertising
- Page 171 and 172: Chapter 9 Checking out Advertising
- Page 173 and 174: Chapter 9: Checking out Advertising
- Page 175 and 176: Chapter 9: Checking out Advertising
- Page 177 and 178: Chapter 9: Checking out Advertising
- Page 179 and 180: Chapter 9: Checking out Advertising
- Page 181 and 182: Chapter 9: Checking out Advertising
- Page 183 and 184: Chapter 9: Checking out Advertising
- Page 185 and 186: Chapter 9: Checking out Advertising
- Page 187 and 188: Chapter 10 Measuring Advertising Su
- Page 189 and 190: Chapter 10: Measuring Advertising S
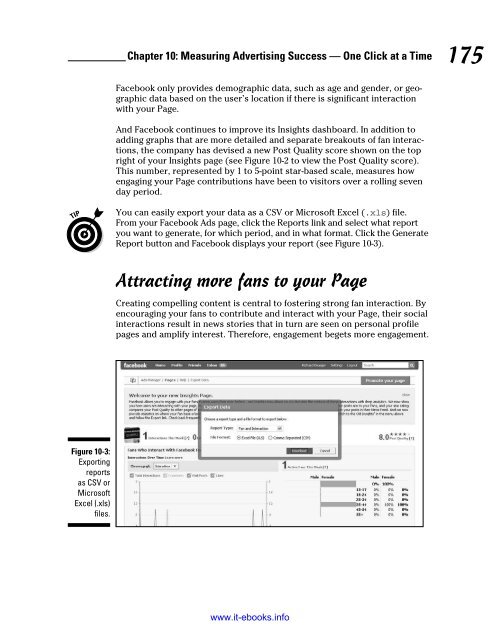
- Page 191: Chapter 10: Measuring Advertising S
- Page 195 and 196: Chapter 11 Buying and Selling withi
- Page 197 and 198: Chapter 11: Buying and Selling with
- Page 199 and 200: Chapter 11: Buying and Selling with
- Page 201 and 202: Chapter 11: Buying and Selling with
- Page 203 and 204: Chapter 11: Buying and Selling with
- Page 205 and 206: Chapter 11: Buying and Selling with
- Page 207 and 208: Chapter 11: Buying and Selling with
- Page 209 and 210: Chapter 11: Buying and Selling with
- Page 211 and 212: Chapter 11: Buying and Selling with
- Page 213 and 214: Part IV Riding the Facebook Viral W
- Page 215 and 216: Chapter 12 Dressing Up Your Faceboo
- Page 217 and 218: Chapter 12: Dressing Up Your Facebo
- Page 219 and 220: Chapter 12: Dressing Up Your Facebo
- Page 221 and 222: Chapter 12: Dressing Up Your Facebo
- Page 223 and 224: Chapter 12: Dressing Up Your Facebo
- Page 225 and 226: Chapter 13 Hosting Your Own Faceboo
- Page 227 and 228: Chapter 13: Hosting Your Own Facebo
- Page 229 and 230: Chapter 13: Hosting Your Own Facebo
- Page 231 and 232: Chapter 13: Hosting Your Own Facebo
- Page 233 and 234: Chapter 14 Surveying the Crowd In T
- Page 235 and 236: Chapter 14: Surveying the Crowd 217
- Page 237 and 238: Chapter 14: Surveying the Crowd 219
- Page 239 and 240: Chapter 14: Surveying the Crowd 221
- Page 241 and 242: Chapter 15 Reaching out Further wit
- Page 243 and 244:
Chapter 15: Reaching out Further wi
- Page 245 and 246:
Chapter 15: Reaching out Further wi
- Page 247 and 248:
Chapter 15: Reaching out Further wi
- Page 249 and 250:
Chapter 15: Reaching out Further wi
- Page 251 and 252:
Chapter 15: Reaching out Further wi
- Page 253 and 254:
Part V The Part of Tens www.it-eboo
- Page 255 and 256:
Chapter 16 Ten Reasons Why Your Bus
- Page 257 and 258:
Chapter 16: Ten Reasons Why Your Bu
- Page 259 and 260:
Chapter 17 Ten Business Etiquette T
- Page 261 and 262:
Chapter 17: Ten Business Etiquette
- Page 263 and 264:
Chapter 18 Ten Facebook Blogs for B
- Page 265 and 266:
Chapter 18: Ten Facebook Blogs for
- Page 267 and 268:
Chapter 19 Ten (Plus One) Must-Have
- Page 269 and 270:
Chapter 19: Ten (Plus One) Must-Hav
- Page 271 and 272:
Chapter 19: Ten (Plus One) Must-Hav
- Page 273 and 274:
Chapter 19: Ten (Plus One) Must-Hav
- Page 275 and 276:
Appendix A Web Links for Facebook M
- Page 277 and 278:
Appendix A: Web Links for Facebook
- Page 279 and 280:
Appendix A: Web Links for Facebook
- Page 281 and 282:
Appendix A: Web Links for Facebook
- Page 283 and 284:
Appendix A: Web Links for Facebook
- Page 285 and 286:
Appendix B Protecting Your Identity
- Page 287 and 288:
Appendix B: Protecting Your Identit
- Page 289 and 290:
Appendix B: Protecting Your Identit
- Page 291 and 292:
Appendix B: Protecting Your Identit
- Page 293 and 294:
Appendix B: Protecting Your Identit
- Page 295 and 296:
Appendix B: Protecting Your Identit
- Page 297 and 298:
Index • A • AboutFaceDigital bl
- Page 299 and 300:
Index 281 SlideShare, 73, 252 Socia
- Page 301 and 302:
Index 283 Discussions tab, 58, 66-6
- Page 303 and 304:
Index 285 joining, 49, 122 limitati
- Page 305 and 306:
Index 287 My Del.icio.us applicatio
- Page 307 and 308:
Index 289 viewing, 40, 47 viewing P
- Page 309 and 310:
Index 291 bulletin boards, 264 for
- Page 311 and 312:
Index 293 • U • updates, status
- Page 313 and 314:
Business/Accounting & Bookkeeping B
- Page 315:
Internet Marketing/Social Media Con