- Page 3:
SAGARMALA “Building Gateways of G
- Page 8 and 9:
ii Globally, ports have had a signi
- Page 10 and 11:
iv ■ ■ ■ Port led development
- Page 12 and 13:
vi Hamburg - Le Havre (HLH) range i
- Page 14 and 15:
viii Steel production follows an in
- Page 16 and 17:
x Port enabled eco-system of Steel
- Page 18 and 19:
xii Export-driven production is two
- Page 20 and 21:
xiv Overview of Shenzhen Key facts
- Page 22 and 23:
xvi Shenzhen had a substantial impa
- Page 25 and 26:
Executive summary i
- Page 27 and 28:
iii Comparative impact of port-led
- Page 29 and 30:
v Impact from Sagarmala - 2025 INR
- Page 31 and 32:
vii ■ ■ ■ Comparison of end-t
- Page 33 and 34:
ix Sagarmala: Port-led development
- Page 35 and 36:
xi Traffic handled at Indian ports
- Page 37 and 38:
xiii EXIM and domestic shipping car
- Page 39 and 40:
xv 6-8 potential new ports based on
- Page 41 and 42:
xvii
- Page 43 and 44:
xix
- Page 45 and 46:
xxi Proposed coastal economic zones
- Page 47 and 48:
xxiii
- Page 49 and 50:
xxv 40 lakh potential new direct jo
- Page 51:
xxvii Sagarmala could mobilise inve
- Page 54 and 55:
2 -
- Page 56 and 57:
4 Demand centres, production and di
- Page 58 and 59:
6 Export decision of private player
- Page 60 and 61:
8 LPG demand to outpace domestic pr
- Page 62 and 63:
10 Even in the best case scenario,
- Page 64 and 65:
12 Gas demand may be concentrated i
- Page 66 and 67:
14 12
- Page 68 and 69:
16 , 10 states account for 80% of c
- Page 70 and 71:
18 Demand growth for thermal coal G
- Page 72 and 73:
20 Example of optimisation model: N
- Page 74 and 75:
22 Key clusters for coastal movemen
- Page 76 and 77:
24 Steel production in India MTPA 6
- Page 78 and 79:
26 Steel plants 1 relevant for coki
- Page 80 and 81:
28 Imported coking coal origin by c
- Page 82 and 83:
30 Iron ore movement in India, FY 1
- Page 84 and 85:
32 Iron ore import: Source country
- Page 86 and 87:
34 Prevalent market conditions make
- Page 88 and 89:
36 — —
- Page 90 and 91:
38 Almost every major plant has the
- Page 92 and 93:
40 Demand and supply of cement A de
- Page 94 and 95:
42 Modes used for cement transporta
- Page 96 and 97:
44 Plant-wise potential to shift to
- Page 98 and 99:
46 Imported finished fertilisers: O
- Page 100 and 101:
48 - Methodology snapshot: For each
- Page 102 and 103:
50 ■ ■
- Page 104 and 105:
52 EXIM container volumes split for
- Page 106 and 107:
54 Overview of expected container t
- Page 108 and 109:
56 Comparison of end-to-end time of
- Page 111 and 112:
59 2. Port modernisation Prominent
- Page 113 and 114:
61 Comparison of port-related KPIs
- Page 115 and 116:
63 Port-wise capacity utilisation C
- Page 117 and 118:
65 State-wise cargo traffic in 2015
- Page 119 and 120:
67 EXIM and domestic shipping cargo
- Page 121 and 122:
69 Most ports in India characterise
- Page 123 and 124:
71 Substantial performance change t
- Page 125 and 126:
73 ■ ■ Ports with cape-size han
- Page 127 and 128:
75 ■ ■ ■ ■ ■ ■ ■ ■
- Page 129 and 130:
77 Traffic forecast for West Bengal
- Page 131 and 132:
79 West Bengal cluster: New opportu
- Page 133 and 134:
81
- Page 135 and 136:
83 Ports in the northern Andhra Pra
- Page 137 and 138:
85
- Page 139 and 140:
87 ■ ■ ■
- Page 141 and 142:
89 Northern TN cluster: New opportu
- Page 143 and 144:
91
- Page 145 and 146:
93 Kerala cluster: New opportunitie
- Page 147 and 148:
95 - Ports in the Karnataka cluster
- Page 149 and 150:
97 Mangalore Port: New opportunitie
- Page 151 and 152:
- 99
- Page 153 and 154:
101
- Page 155 and 156:
103 ■ ■ ■ - - - - ■
- Page 157 and 158:
105 Northern Maharashtra: New oppor
- Page 159 and 160:
107 Ports in the Saurashtra cluster
- Page 161 and 162:
109
- Page 163 and 164:
111
- Page 165 and 166:
113 New port identification framewo
- Page 167 and 168:
115 Traffic projection for Vadhavan
- Page 169 and 170:
117 Deviation from main sailing rou
- Page 171 and 172:
119 ■ ■ Traffic projection for
- Page 173 and 174:
121 Coal: Non-availability of port
- Page 175 and 176:
123 Traffic projection for Paradip
- Page 177 and 178:
125 Eastern Hinterland: Kolkata Doc
- Page 179:
127 Cargo handled at Haldia and Kol
- Page 182 and 183:
130
- Page 184 and 185:
132 Comparison of end-to-end time o
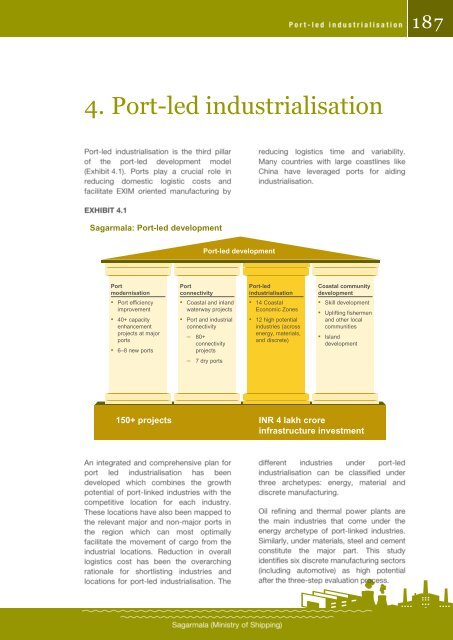
- Page 186 and 187:
134 Commodity to mode mapping Road
- Page 188 and 189: 136 Current rail network is congest
- Page 190 and 191: 138 BAGALKOT (BGK) 93.290 BELGAUM (
- Page 192 and 193: 140 Hinterland evacuation is domina
- Page 194 and 195: 142 High freight charges making rai
- Page 196 and 197: 144 Current crude pipeline network
- Page 198 and 199: 146 Current product pipeline networ
- Page 200 and 201: 148 NW1 is 1,620 km navigable stret
- Page 202 and 203: 150 National waterway - 5 Jharsugud
- Page 204 and 205: 152 National Waterway 2 Congested r
- Page 206 and 207: 154 - - Key clusters for coastal mo
- Page 208 and 209: 156 IB Valley/Taclher to Paradip/Dh
- Page 210 and 211: 158 ■ ■ ■ ■ ■ ■ ■ ■
- Page 212 and 213: 160 ■ ■
- Page 214 and 215: 162
- Page 216 and 217: 164 Based on the above analysis we
- Page 218 and 219: 166 Location justification for Tela
- Page 220 and 221: 168 ■ → → → ■ → → ■
- Page 222 and 223: 170 Enabler for increased rail shar
- Page 224 and 225: 172 Comparison of carrying a contai
- Page 226 and 227: 174 Current and potential critical
- Page 228 and 229: 176 ■ ■ ■ ■ ■ ■ ■ ■
- Page 230 and 231: 178
- Page 232 and 233: 180
- Page 234 and 235: 182 Four levers identified for cost
- Page 236 and 237: 184 ■ ■ 4. 2. ■ ■ ■ ■
- Page 240 and 241: 188
- Page 242 and 243: 190 Projections for India’s energ
- Page 244 and 245: 192 Trade balance of petrochemicals
- Page 246 and 247: 194 Potential Impact from each gas-
- Page 248 and 249: 196 - Logistics is the largest cost
- Page 250 and 251: 198 Coastal cement plants provide l
- Page 252 and 253: 200 Coastal steel capacity in India
- Page 254 and 255: 202 South Korean Maritime cluster-
- Page 256 and 257: 204 MARKET TRENDS China, Korea and
- Page 258 and 259: 206 India currently produces only ~
- Page 260 and 261: 208 Key Government Policies and Ini
- Page 262 and 263: 210 Passenger vehicles have the big
- Page 264 and 265: 212 Automotive cargo flows from Ind
- Page 266 and 267: 214 This vision promises to transfo
- Page 268 and 269: 216 ■ ■
- Page 270 and 271: 218 Summary of the selection proces
- Page 272 and 273: 220 Scoring of discrete manufacturi
- Page 274 and 275: 222 Share of India vis-à-vis China
- Page 276 and 277: 224 India’s share of apparel expo
- Page 278 and 279: 226 ■ - Origin-destination pairs
- Page 280 and 281: 228 Potential Impact from each appa
- Page 282 and 283: 230 Leather consumption in India Ma
- Page 284 and 285: 232 - - - - - Comparison of Indian
- Page 286 and 287: 234 Potential Impact from each leat
- Page 288 and 289:
236 Share of global processed food
- Page 290 and 291:
238 Footprints of processed food se
- Page 292 and 293:
240 India’s export basket compris
- Page 294 and 295:
242 India’s food-processing compe
- Page 296 and 297:
244 Global furniture markets export
- Page 298 and 299:
246 Key global trade flows SOURCE:
- Page 300 and 301:
248 Key clusters in India Mundra Ja
- Page 302 and 303:
250 70% of the installed capacity i
- Page 304 and 305:
252 China is by far the largest ele
- Page 306 and 307:
254 ■ ■ ■ Chennai-Bengaluru c
- Page 308 and 309:
256 ■ ■ Nearly all the Fabs acr
- Page 310 and 311:
258 High synergies between automoti
- Page 312 and 313:
260
- Page 314 and 315:
262 Most of the proposed discrete m
- Page 316 and 317:
264 ■ ■ ■ ■ ■ ■ ■
- Page 318 and 319:
266 ■ ■ ■ ■
- Page 320 and 321:
268 Impact of economic development:
- Page 322 and 323:
270 Approach for skill development
- Page 324 and 325:
272 Occupation profile # of fisherf
- Page 326 and 327:
274 Housing infrastructure % fisher
- Page 328 and 329:
276 Marine fish production trend Fi
- Page 330 and 331:
278 ■ ■ ■ ■ ■ ■
- Page 332 and 333:
280 Number of islands Points (rocks
- Page 334 and 335:
282 ■ ■ ■ ■ ‒ ■ ‒ ■