october 2012 - TOJET the Turkish online journal of educational ...
october 2012 - TOJET the Turkish online journal of educational ...
october 2012 - TOJET the Turkish online journal of educational ...

Create successful ePaper yourself
Turn your PDF publications into a flip-book with our unique Google optimized e-Paper software.
<strong>TOJET</strong>: The <strong>Turkish</strong> Online Journal <strong>of</strong> Educational Technology – October <strong>2012</strong>, volume 11 Issue 4<br />
on making SUS more suitable to artwork evaluation.<br />
SUS is a questionnaire to estimate users’ subjective feelings <strong>of</strong> <strong>the</strong> system and fur<strong>the</strong>r know <strong>the</strong>ir degrees <strong>of</strong><br />
satisfaction. In <strong>the</strong> aspect <strong>of</strong> system usability evaluation, <strong>the</strong> SUS is an efficient, time-conserving, and<br />
labor-saving way <strong>of</strong> subjective estimate. At present, it is widely applied in <strong>the</strong> system usability. After users<br />
finishing answering ten questions, <strong>the</strong> scale <strong>of</strong>fers a formula which transfers <strong>the</strong> subjective feelings <strong>of</strong> users into<br />
<strong>the</strong> objective data information for analysis. That is, <strong>the</strong> score <strong>of</strong> SUS is used to evaluate usability <strong>of</strong> <strong>the</strong> system.<br />
The range <strong>of</strong> estimate score is from 0 to 100. The higher <strong>the</strong> score is, <strong>the</strong> more useful <strong>the</strong> system is and <strong>the</strong> more<br />
easily users can interact with it.<br />
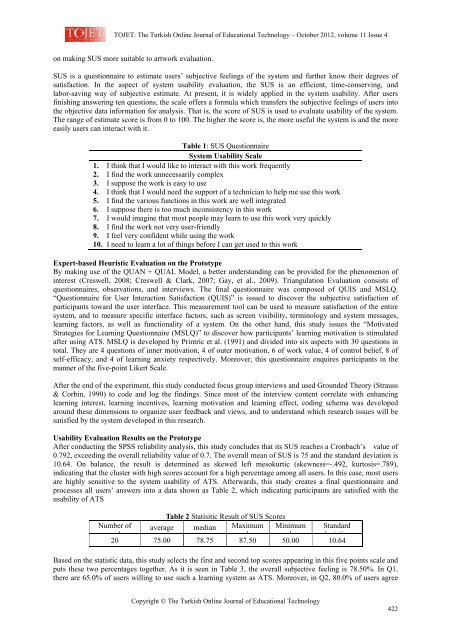
Table 1: SUS Questionnaire<br />
System Usability Scale<br />
1. I think that I would like to interact with this work frequently<br />
2. I find <strong>the</strong> work unnecessarily complex<br />
3. I suppose <strong>the</strong> work is easy to use<br />
4. I think that I would need <strong>the</strong> support <strong>of</strong> a technician to help me use this work<br />
5. I find <strong>the</strong> various functions in this work are well integrated<br />
6. I suppose <strong>the</strong>re is too much inconsistency in this work<br />
7. I would imagine that most people may learn to use this work very quickly<br />
8. I find <strong>the</strong> work not very user-friendly<br />
9. I feel very confident while using <strong>the</strong> work<br />
10. I need to learn a lot <strong>of</strong> things before I can get used to this work<br />
Expert-based Heuristic Evaluation on <strong>the</strong> Prototype<br />
By making use <strong>of</strong> <strong>the</strong> QUAN + QUAL Model, a better understanding can be provided for <strong>the</strong> phenomenon <strong>of</strong><br />
interest (Creswell, 2008; Creswell & Clark, 2007; Gay, et al., 2009). Triangulation Evaluation consists <strong>of</strong><br />
questionnaires, observations, and interviews. The final questionnaire was composed <strong>of</strong> QUIS and MSLQ.<br />
“Questionnaire for User Interaction Satisfaction (QUIS)” is issued to discover <strong>the</strong> subjective satisfaction <strong>of</strong><br />
participants toward <strong>the</strong> user interface. This measurement tool can be used to measure satisfaction <strong>of</strong> <strong>the</strong> entire<br />
system, and to measure specific interface factors, such as screen visibility, terminology and system messages,<br />
learning factors, as well as functionality <strong>of</strong> a system. On <strong>the</strong> o<strong>the</strong>r hand, this study issues <strong>the</strong> “Motivated<br />
Strategies for Learning Questionnaire (MSLQ)” to discover how participants’ learning motivation is stimulated<br />
after using ATS. MSLQ is developed by Printric et al. (1991) and divided into six aspects with 30 questions in<br />
total. They are 4 questions <strong>of</strong> inner motivation, 4 <strong>of</strong> outer motivation, 6 <strong>of</strong> work value, 4 <strong>of</strong> control belief, 8 <strong>of</strong><br />
self-efficacy, and 4 <strong>of</strong> learning anxiety respectively. Moreover, this questionnaire enquires participants in <strong>the</strong><br />
manner <strong>of</strong> <strong>the</strong> five-point Likert Scale.<br />
After <strong>the</strong> end <strong>of</strong> <strong>the</strong> experiment, this study conducted focus group interviews and used Grounded Theory (Strauss<br />
& Corbin, 1990) to code and log <strong>the</strong> findings. Since most <strong>of</strong> <strong>the</strong> interview content correlate with enhancing<br />
learning interest, learning incentives, learning motivation and learning effect, coding schema was developed<br />
around <strong>the</strong>se dimensions to organize user feedback and views, and to understand which research issues will be<br />
satisfied by <strong>the</strong> system developed in this research.<br />
Usability Evaluation Results on <strong>the</strong> Prototype<br />
After conducting <strong>the</strong> SPSS reliability analysis, this study concludes that its SUS reaches a Cronbach’s value <strong>of</strong><br />
0.792, exceeding <strong>the</strong> overall reliability value <strong>of</strong> 0.7. The overall mean <strong>of</strong> SUS is 75 and <strong>the</strong> standard deviation is<br />
10.64. On balance, <strong>the</strong> result is determined as skewed left mesokurtic (skewness=-.492, kurtosis=.789),<br />
indicating that <strong>the</strong> cluster with high scores account for a high percentage among all users. In this case, most users<br />
are highly sensitive to <strong>the</strong> system usability <strong>of</strong> ATS. Afterwards, this study creates a final questionnaire and<br />
processes all users’ answers into a data shown as Table 2, which indicating participants are satisfied with <strong>the</strong><br />
usability <strong>of</strong> ATS<br />
Table 2 Statisitic Result <strong>of</strong> SUS Scores<br />
Number <strong>of</strong><br />
samples<br />
20<br />
average<br />
75.00<br />
median<br />
78.75<br />
Maximum<br />
value<br />
87.50<br />
Minimum<br />
value<br />
50.00<br />
Standard<br />
deviation<br />
10.64<br />
Based on <strong>the</strong> statistic data, this study selects <strong>the</strong> first and second top scores appearing in this five points scale and<br />
puts <strong>the</strong>se two percentages toge<strong>the</strong>r. As it is seen in Table 3, <strong>the</strong> overall subjective feeling is 78.50%. In Q1,<br />
<strong>the</strong>re are 65.0% <strong>of</strong> users willing to use such a learning system as ATS. Moreover, in Q2, 80.0% <strong>of</strong> users agree<br />
Copyright © The <strong>Turkish</strong> Online Journal <strong>of</strong> Educational Technology<br />
422