

Research Results - (PDF, 101 mb) - USAID
Research Results - (PDF, 101 mb) - USAID
Research Results - (PDF, 101 mb) - USAID

You also want an ePaper? Increase the reach of your titles
YUMPU automatically turns print PDFs into web optimized ePapers that Google loves.
years of age resulted in upward trends for milk<br />
and body weight, with the greatest response<br />
observed for culling at eight years. Culling at<br />
five years of age did not increase weight at sale<br />
or milk yield. Instead, production for these ,',o<br />
characters dropped below initial values during<br />
the early stages of selection and returned to<br />
initial values at the end of the simulation.<br />
Average breeding ewe generation nu<strong>mb</strong>er<br />
and average ewe age at the end of each<br />
simulated scenario are reported in table 5. As<br />
selection intensity increased, generation interval<br />
was longer and ewes were, on average, older as<br />
a result of culling intensity. By using rams for<br />
one year, nu<strong>mb</strong>er of generations increased;<br />
therefore, an increase in genetic progress was<br />
simulated. Increasing the rate of genetic change<br />
via the rams did not have an impact on flock<br />
performance. Instead, culling age of ewes<br />
created greater differences between selection<br />
schemes.<br />
These simulations provide insight into<br />
the changes of flock performance as different<br />
selection programs were imposed upon a population<br />
of sheep where there had been no selection<br />
practiced. It was clear that in the harsh<br />
environment simulated, where both meat and<br />
milk offtake are important components of the<br />
sheep enterprise, care must be taken as to the<br />
speed with which programs are implemented.<br />
Using computer simulation provides an additional<br />
tool for animal breeders to use to make a<br />
priorievaluations of selection strategies and<br />
goals and the manner in which these objectives<br />
are obtained.<br />
Resistance to Haemonchus contortus<br />
A. RFLP AnAysis<br />
With the collaboration of the Washington<br />
State University Health project and Dr. R.M.<br />
Waruiru of the Department of Veterinary Pathology<br />
and Microbiology, University of<br />
Nairobi, a total of 95 kids have been artificially<br />
infected with 10,000 H. contortuslarvae to screen<br />
for resistance. These animals are in addition to<br />
those monitored for natural infection. Of these<br />
animals, one doe has shown no detectable level<br />
of infection in fecal egg counts in three separate<br />
artificial infestations. This is an exciting discovery<br />
which may allow a unique opportunity to<br />
map the genes responsible for regulation of<br />
resistance to H. contortus. An e<strong>mb</strong>ryo transfer<br />
program is planned to create a halfsib family as<br />
large as possible from this doe to augment<br />
existing family data.<br />
In 1987, 134 weaned kids were placed on<br />
a one-year experiment to determine their resistance<br />
to internal parasites. Body weight change,<br />
packed cell volume (PCV), and fecal egg counts<br />
(FEC) were monitored. When PCV and/or FEC<br />
reached critical levels, the kids were drenched<br />
with an anthelmintic. Of the 134 tested individuals,<br />
13 were never treated for parasite load.<br />
Several interesting results emerged from a<br />
summary of the data. Of the 25 sires represented<br />
by their progeny in this test, only six<br />
produced progeny which were resistant or<br />
resilient. The proportion of progeny on test<br />
which were resistant was 3.6% for an EAG buck,<br />
7.4% for two Toggenburg bucks, and 15.4% for a<br />
DPG buck.<br />
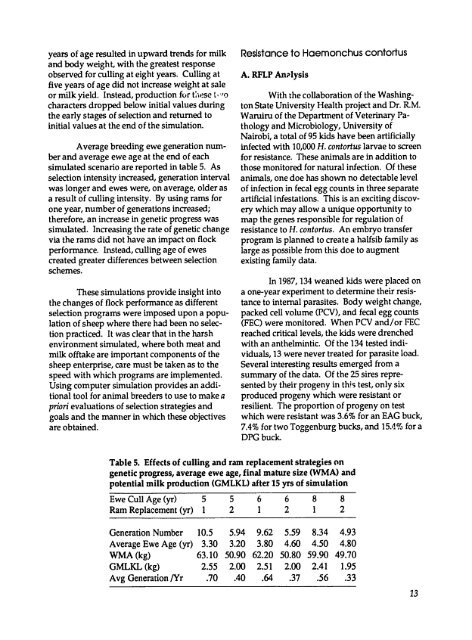
Table 5. Effects of culling and ram replacement strategies on<br />
genetic progress, average ewe age, final mature size (WMA) and<br />
potential milk production (GMLKL) after 15 yrs of simulation<br />
Ewe Cull Age (yr)<br />
Ram Replacement (yr)<br />
Generation Nu<strong>mb</strong>er<br />
Average Ewe Age (yr)<br />
WMA (kg)<br />
GMLKL (kg)<br />
Avg Generation /Yr<br />
5 5 6 6 8 8<br />
1 2 1 2 1 2<br />
10.5 5.94 9.62 5.59 8.34 4.93<br />
3.30 3.20 3.80 4.60 4.50 4.80<br />
63.10 50.90 62.20 50.80 59.90 49.70<br />
2.55 2.00 2.51 2.00 2.41 1.95<br />
.70 .40 .64 .37 .56 .33<br />
13


