WIC EBT Feasibility Study and Cost‐Benefit Analysis
WIC EBT Feasibility Study and Cost‐Benefit Analysis
WIC EBT Feasibility Study and Cost‐Benefit Analysis

You also want an ePaper? Increase the reach of your titles
YUMPU automatically turns print PDFs into web optimized ePapers that Google loves.
Virginia Department of Health <strong>WIC</strong> <strong>EBT</strong> <strong>Feasibility</strong> <strong>Study</strong> <strong>and</strong> Cost-Benefit <strong>Analysis</strong><br />
Alternative 1: Alternative 2: Alternative 3:<br />
Weight On-Line Outsourced On-Line In-house Off-Line In-house<br />
Score Weighted Score Weighted Score Weighted<br />
Score<br />
Score<br />
Score<br />
Investment in Retailer<br />
Hardware/Software<br />
3 2 6 1 3 1 3<br />
Ability to Adapt to Change<br />
in Technology<br />
4 3 12 1 4 1 4<br />
System <strong>and</strong> Data Security 4 3 12 3 12 3 12<br />
Able to Meet the Schedule<br />
Established for SAM<br />
5 3 15 1 5 2 10<br />
Total Weighted Scores 152 86 131<br />
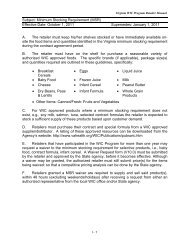
5.6 RISKS<br />
In cooperation with the State, a risk analysis was conducted using st<strong>and</strong>ard system development<br />
life cycle (SDLC) risk categories. Scores were weighted by rating the impact of the risk on the<br />
ability of the State to implement e-<strong>WIC</strong> on budget <strong>and</strong> within schedule<br />
Risks were measured numerically with the lowest risk items receiving the lowest numerical<br />
scores.<br />
• Risks were first weighted from 1 to 3 with 1 having the lowest risk to the State’s project<br />
<strong>and</strong> 3 having the highest risk to the State’s project.<br />
• Each alternative was then rated from 1 to 3, with a 1 rating signifying that the risk has<br />
little or no impact on the alternative <strong>and</strong> 3 being the risk has the greatest impact on the<br />
alternative.<br />
• The weight was multiplied by the alternative’s risk factor to arrive at a risk rating.<br />
The table below provides the calculated risk rating of each alternative. Risk ratings range from 1<br />
to 9, with 1 being the lowest risk <strong>and</strong> 9 the highest risk. As seen in the table below, the analysis<br />
indicates that the off-line, in-house solution has the lowest average risk rating <strong>and</strong> therefore is<br />
seen to pose the least risk to the State. This lower risk is related to the alternative’s proven<br />
abilities, portability, <strong>and</strong> readiness for implementation.<br />
29 V 1.2 August 20, 2008