The Benetton Group Annual Report 1996
The Benetton Group Annual Report 1996
The Benetton Group Annual Report 1996

Create successful ePaper yourself
Turn your PDF publications into a flip-book with our unique Google optimized e-Paper software.
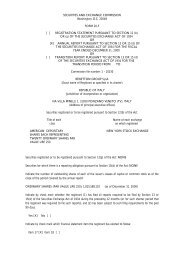
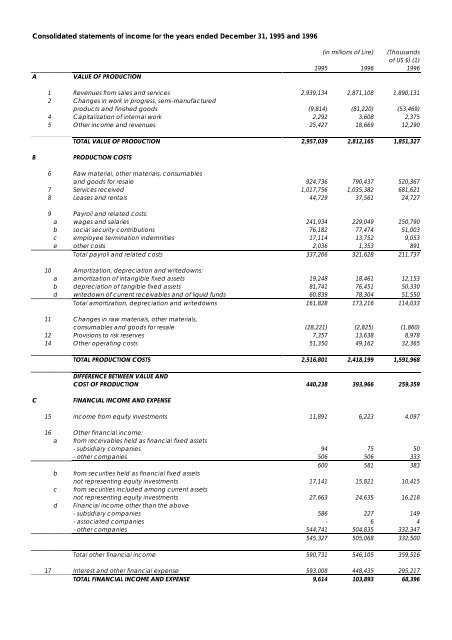
Consolidated statements of income for the years ended December 31, 1995 and <strong>1996</strong><br />
A VALUE OF PRODUCTION<br />
(in millions of Lire) (Thousands<br />
of US $) (1)<br />
1995 <strong>1996</strong> <strong>1996</strong><br />
1 Revenues from sales and services 2,939,134 2,871,108 1,890,131<br />
2 Changes in work in progress, semi-manufactured<br />
products and finished goods (9,814) (81,220) (53,469)<br />
4 Capitalization of internal work 2,292 3,608 2,375<br />
5 Other income and revenues 25,427 18,669 12,290<br />
TOTAL VALUE OF PRODUCTION 2,957,039 2,812,165 1,851,327<br />
B PRODUCTION COSTS<br />
6 Raw material, other materials, consumables<br />
and goods for resale 924,736 790,437 520,367<br />
7 Services received 1,017,756 1,035,382 681,621<br />
8 Leases and rentals 44,729 37,561 24,727<br />
9 Payroll and related costs:<br />
a wages and salaries 241,934 229,049 150,790<br />
b social security contributions 76,182 77,474 51,003<br />
c employee termination indemnities 17,114 13,752 9,053<br />
e other costs 2,036 1,353 891<br />
Total payroll and related costs 337,266 321,628 211,737<br />
10 Amortization, depreciation and writedowns:<br />
a amortization of intangible fixed assets 19,248 18,461 12,153<br />
b depreciation of tangible fixed assets 81,741 76,451 50,330<br />
d writedown of current receivables and of liquid funds 60,839 78,304 51,550<br />
Total amortization, depreciation and writedowns 161,828 173,216 114,033<br />
11 Changes in raw materials, other materials,<br />
consumables and goods for resale (28,221) (2,825) (1,860)<br />
12 Provisions to risk reserves 7,357 13,638 8,978<br />
14 Other operating costs 51,350 49,162 32,365<br />
TOTAL PRODUCTION COSTS 2,516,801 2,418,199 1,591,968<br />
DIFFERENCE BETWEEN VALUE AND<br />
COST OF PRODUCTION 440,238 393,966 259,359<br />
C FINANCIAL INCOME AND EXPENSE<br />
15 Income from equity investments 11,891 6,223 4,097<br />
16 Other financial income:<br />
a from receivables held as financial fixed assets<br />
- subsidiary companies 94 75 50<br />
- other companies 506 506 333<br />
600 581 383<br />
b from securities held as financial fixed assets<br />
not representing equity investments 17,141 15,821 10,415<br />
c from securities included among current assets<br />
not representing equity investments 27,663 24,635 16,218<br />
d Financial income other than the above<br />
- subsidiary companies 586 227 149<br />
- associated companies - 6 4<br />
- other companies 544,741 504,835 332,347<br />
545,327 505,068 332,500<br />
Total other financial income 590,731 546,105 359,516<br />
17 Interest and other financial expense 593,008 448,435 295,217<br />
TOTAL FINANCIAL INCOME AND EXPENSE 9,614 103,893 68,396