The Benetton Group Annual Report 1996
The Benetton Group Annual Report 1996
The Benetton Group Annual Report 1996

Create successful ePaper yourself
Turn your PDF publications into a flip-book with our unique Google optimized e-Paper software.
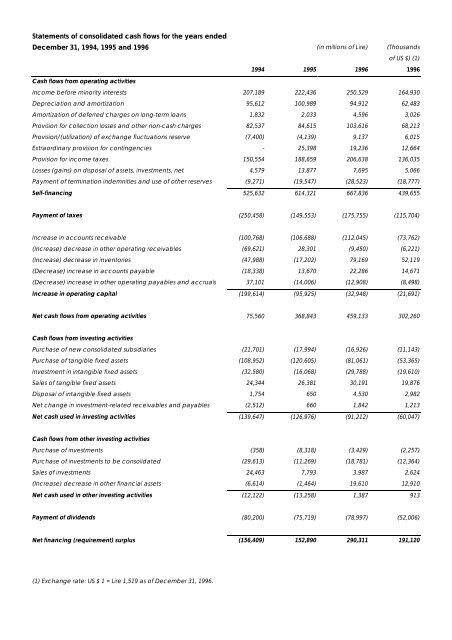
Statements of consolidated cash flows for the years ended<br />
December 31, 1994, 1995 and <strong>1996</strong> (in millions of Lire) (Thousands<br />
Cash flows from operating activities<br />
of US $) (1)<br />
1994 1995 <strong>1996</strong> <strong>1996</strong><br />
Income before minority interests 207,189 222,436 250,529 164,930<br />
Depreciation and amortization 95,612 100,989 94,912 62,483<br />
Amortization of deferred charges on long-term loans 1,832 2,033 4,596 3,026<br />
Provision for collection losses and other non-cash charges 82,537 84,615 103,616 68,213<br />
Provision/(utilization) of exchange fluctuations reserve (7,400) (4,139) 9,137 6,015<br />
Extraordinary provision for contingencies - 25,398 19,236 12,664<br />
Provision for income taxes 150,554 188,659 206,638 136,035<br />
Losses (gains) on disposal of assets, investments, net 4,579 13,877 7,695 5,066<br />
Payment of termination indemnities and use of other reserves (9,271) (19,547) (28,523) (18,777)<br />
Self-financing 525,632 614,321 667,836 439,655<br />
Payment of taxes (250,458) (149,553) (175,755) (115,704)<br />
Increase in accounts receivable (100,768) (106,688) (112,045) (73,762)<br />
(Increase) decrease in other operating receivables (69,621) 28,301 (9,450) (6,221)<br />
(Increase) decrease in inventories (47,988) (17,202) 79,169 52,119<br />
(Decrease) increase in accounts payable (18,338) 13,670 22,286 14,671<br />
(Decrease) increase in other operating payables and accruals 37,101 (14,006) (12,908) (8,498)<br />
Increase in operating capital (199,614) (95,925) (32,948) (21,691)<br />
Net cash flows from operating activities 75,560 368,843 459,133 302,260<br />
Cash flows from investing activities<br />
Purchase of new consolidated subsidiaries (21,701) (17,994) (16,926) (11,143)<br />
Purchase of tangible fixed assets (108,952) (120,605) (81,061) (53,365)<br />
Investment in intangible fixed assets (32,580) (16,068) (29,788) (19,610)<br />
Sales of tangible fixed assets 24,344 26,381 30,191 19,876<br />
Disposal of intangible fixed assets 1,754 650 4,530 2,982<br />
Net change in investment-related receivables and payables (2,512) 660 1,842 1,213<br />
Net cash used in investing activities (139,647) (126,976) (91,212) (60,047)<br />
Cash flows from other investing activities<br />
Purchase of investments (358) (8,318) (3,429) (2,257)<br />
Purchase of investments to be consolidated (29,613) (11,269) (18,781) (12,364)<br />
Sales of investments 24,463 7,793 3,987 2,624<br />
(Increase) decrease in other financial assets (6,614) (1,464) 19,610 12,910<br />
Net cash used in other investing activities (12,122) (13,258) 1,387 913<br />
Payment of dividends (80,200) (75,719) (78,997) (52,006)<br />
Net financing (requirement) surplus (156,409) 152,890 290,311 191,120<br />
(1) Exchange rate: US $ 1 = Lire 1,519 as of December 31, <strong>1996</strong>.