preface
preface
preface

You also want an ePaper? Increase the reach of your titles
YUMPU automatically turns print PDFs into web optimized ePapers that Google loves.
14<br />
THE ISRAELI ECONOMY IN 2010<br />
Compared to 2009, stock trading in 2010 was extremely dynamic, with<br />
turnovers close to the record levels of 2007. In addition, activities in the<br />
primary market increased, after having stagnated for two years.<br />
Consequently, 17 new companies were able to raise US $850 million in<br />
initial public offerings. The daily bonds turnover, amounting to<br />
approximately NIS 3.3 billion in 2010, was 20% lower compared with<br />
the corresponding period in 2009.<br />
2009 was marked by unusually sharp corporate bond price increases<br />
resulting in a 19% gain of the debt market in 2010. In addition, the<br />
private sector took advantage of the low interest rates to raise US $10.5<br />
billion, similar to the amount raised in the previous year.<br />
By the end of the year, around 418 index products were traded on TASE<br />
as the market for exchange-traded index products experienced a<br />
continuous growth. In parallel, the market value of public holdings of<br />
Exchange Trade Notes rose, reaching around US $14 billion, as opposed<br />
to US$ 12 billion at the end of 2009.<br />
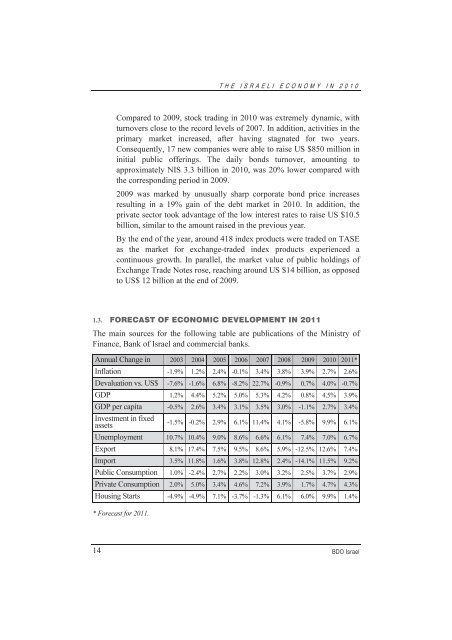
1.3. FORECAST OF ECONOMIC DEVELOPMENT IN 2011<br />
The main sources for the following table are publications of the Ministry of<br />
Finance, Bank of Israel and commercial banks.<br />
Annual Change in 2003 2004 2005 2006 2007 2008 2009 2010 2011*<br />
Inflation -1.9% 1.2% 2.4% -0.1% 3.4% 3.8% 3.9% 2.7% 2.6%<br />
Devaluation vs. US$ -7.6% -1.6% 6.8% -8.2% 22.7% -0.9% 0.7% 4.0% -0.7%<br />
GDP 1.2% 4.4% 5.2% 5.0% 5.3% 4.2% 0.8% 4.5% 3.9%<br />
GDP per capita -0.5% 2.6% 3.4% 3.1% 3.5% 3.0% -1.1% 2.7% 3.4%<br />
Investment in fixed<br />
assets<br />
-1.5% -0.2% 2.9% 6.1% 11.4% 4.1% -5.8% 9.9% 6.1%<br />
Unemployment 10.7% 10.4% 9.0% 8.6% 6.6% 6.1% 7.4% 7.0% 6.7%<br />
Export 8.1% 17.4% 7.5% 9.5% 8.6% 5.9% -12.5% 12.6% 7.4%<br />
Import 3.5% 11.8% 1.6% 3.8% 12.8% 2.4% -14.1% 11.5% 9.2%<br />
Public Consumption 1.0% -2.4% 2.7% 2.2% 3.0% 3.2% 2.5% 3.7% 2.9%<br />
Private Consumption 2.0% 5.0% 3.4% 4.6% 7.2% 3.9% 1.7% 4.7% 4.3%<br />
Housing Starts -4.9% -4.9% 7.1% -3.7% -1.3% 6.1% 6.0% 9.9% 1.4%<br />
* Forecast for 2011.<br />
BDO Israel