Review of acute hospital services in the Mid - Health Service Executive
Review of acute hospital services in the Mid - Health Service Executive
Review of acute hospital services in the Mid - Health Service Executive
- TAGS
- acute
- www.hse.ie

Create successful ePaper yourself
Turn your PDF publications into a flip-book with our unique Google optimized e-Paper software.
<strong>Review</strong> <strong>of</strong> <strong>acute</strong> <strong>hospital</strong> <strong>services</strong> <strong>in</strong> HSE <strong>Mid</strong>-West<br />
An action plan for <strong>acute</strong> and community <strong>services</strong><br />
The ratios for <strong>the</strong> majority <strong>of</strong> <strong>acute</strong> <strong>hospital</strong>s are between 2.8 and 3.6 return attendances per<br />
new attendance. Although <strong>the</strong> volume <strong>of</strong> attendances is quite low, it should be noted that <strong>the</strong><br />
Orthopaedic Hospital at Croom has <strong>the</strong> highest ratio <strong>of</strong> Return to New attendances at 1:5.6.<br />
Some <strong>of</strong> this variation may be a result <strong>of</strong> differences <strong>in</strong> case complexity <strong>of</strong> referrals and subspecialisation<br />
between <strong>the</strong> <strong>acute</strong> <strong>hospital</strong> sites although fur<strong>the</strong>r <strong>in</strong>vestigation should be<br />
undertaken to ensure consistency <strong>of</strong> referral protocols and treatment pathways.<br />
Primary, community and cont<strong>in</strong>u<strong>in</strong>g care<br />
The pr<strong>of</strong>ile <strong>of</strong> current service provision predom<strong>in</strong>antly comprises GPs, community nurs<strong>in</strong>g<br />
<strong>services</strong>, community <strong>hospital</strong> facilities, nurs<strong>in</strong>g homes and home care packages. Care is<br />
managed and organised at Local <strong>Health</strong> Office level <strong>of</strong> which <strong>the</strong>re are three <strong>in</strong> HSE <strong>Mid</strong>-<br />
West.<br />
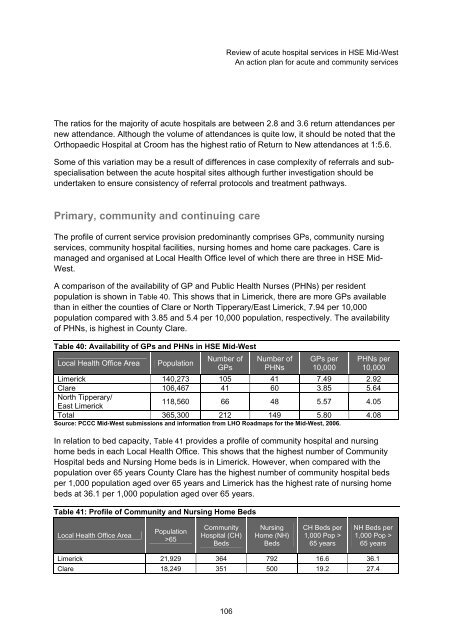
A comparison <strong>of</strong> <strong>the</strong> availability <strong>of</strong> GP and Public <strong>Health</strong> Nurses (PHNs) per resident<br />
population is shown <strong>in</strong> Table 40. This shows that <strong>in</strong> Limerick, <strong>the</strong>re are more GPs available<br />
than <strong>in</strong> ei<strong>the</strong>r <strong>the</strong> counties <strong>of</strong> Clare or North Tipperary/East Limerick, 7.94 per 10,000<br />
population compared with 3.85 and 5.4 per 10,000 population, respectively. The availability<br />
<strong>of</strong> PHNs, is highest <strong>in</strong> County Clare.<br />
Table 40: Availability <strong>of</strong> GPs and PHNs <strong>in</strong> HSE <strong>Mid</strong>-West<br />
Local <strong>Health</strong> Office Area Population<br />
Number <strong>of</strong><br />
GPs<br />
106<br />
Number <strong>of</strong><br />
PHNs<br />
GPs per<br />
10,000<br />
PHNs per<br />
10,000<br />
Limerick 140,273 105 41 7.49 2.92<br />
Clare 106,467 41 60 3.85 5.64<br />
North Tipperary/<br />
118,560 66 48 5.57 4.05<br />
East Limerick<br />
Total 365,300 212 149 5.80 4.08<br />
Source: PCCC <strong>Mid</strong>-West submissions and <strong>in</strong>formation from LHO Roadmaps for <strong>the</strong> <strong>Mid</strong>-West, 2006.<br />
In relation to bed capacity, Table 41 provides a pr<strong>of</strong>ile <strong>of</strong> community <strong>hospital</strong> and nurs<strong>in</strong>g<br />
home beds <strong>in</strong> each Local <strong>Health</strong> Office. This shows that <strong>the</strong> highest number <strong>of</strong> Community<br />
Hospital beds and Nurs<strong>in</strong>g Home beds is <strong>in</strong> Limerick. However, when compared with <strong>the</strong><br />
population over 65 years County Clare has <strong>the</strong> highest number <strong>of</strong> community <strong>hospital</strong> beds<br />
per 1,000 population aged over 65 years and Limerick has <strong>the</strong> highest rate <strong>of</strong> nurs<strong>in</strong>g home<br />
beds at 36.1 per 1,000 population aged over 65 years.<br />
Table 41: Pr<strong>of</strong>ile <strong>of</strong> Community and Nurs<strong>in</strong>g Home Beds<br />
Local <strong>Health</strong> Office Area<br />
Population<br />
>65<br />
Community<br />
Hospital (CH)<br />
Beds<br />
Nurs<strong>in</strong>g<br />
Home (NH)<br />
Beds<br />
CH Beds per<br />
1,000 Pop ><br />
65 years<br />
NH Beds per<br />
1,000 Pop ><br />
65 years<br />
Limerick 21,929 364 792 16.6 36.1<br />
Clare 18,249 351 500 19.2 27.4