Programma di Sviluppo Rurale 2007/2013 - Regione Campania
Programma di Sviluppo Rurale 2007/2013 - Regione Campania
Programma di Sviluppo Rurale 2007/2013 - Regione Campania

Create successful ePaper yourself
Turn your PDF publications into a flip-book with our unique Google optimized e-Paper software.
<strong>Regione</strong> <strong>Campania</strong> PSR <strong>2007</strong>-<strong>2013</strong><br />
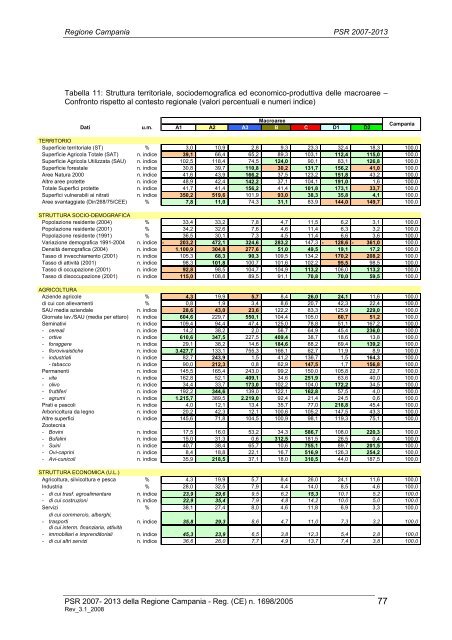
Tabella 11: Struttura territoriale, sociodemografica ed economico-produttiva delle macroaree –<br />
Confronto rispetto al contesto regionale (valori percentuali e numeri in<strong>di</strong>ce)<br />
Dati<br />
Macroaree<br />
u.m. A1 A2 A3 B C D1 D2<br />
<strong>Campania</strong><br />
TERRITORIO<br />
Superficie territoriale (ST) % 3,0 10,9 2,8 9,3 23,3 32,4 18,3 100,0<br />
Superficie Agricola Totale (SAT) n. in<strong>di</strong>ce 39,1 66,4 65,2 89,3 103,1 112,4 115,0 100,0<br />
Superficie Agricola Utilizzata (SAU) n. in<strong>di</strong>ce 102,5 118,4 74,5 124,0 90,1 83,1 126,8 100,0<br />
Superficie forestale n. in<strong>di</strong>ce 30,8 39,7 110,8 30,2 131,7 156,2 41,0 100,0<br />
Aree Natura 2000 n. in<strong>di</strong>ce 41,6 43,9 166,2 37,5 123,2 151,8 43,2 100,0<br />
Altre aree protette n. in<strong>di</strong>ce 48,9 42,4 142,2 37,1 104,1 191,0 1,6 100,0<br />
Totale Superfici protette n. in<strong>di</strong>ce 41,7 41,4 156,2 41,4 101,8 173,1 33,7 100,0<br />
Superfici vulnerabili ai nitrati n. in<strong>di</strong>ce 350,2 519,6 101,9 93,0 38,3 35,8 4,1 100,0<br />
Aree svantaggiate (Dir/268/75/CEE) % 7,8 11,0 74,3 31,1 83,9 144,0 149,7 100,0<br />
STRUTTURA SOCIO-DEMOGRAFICA<br />
Popolazione residente (2004) % 33,4 33,2 7,8 4,7 11,5 6,2 3,1 100,0<br />
Popolazione residente (2001) % 34,2 32,6 7,6 4,6 11,4 6,3 3,2 100,0<br />
Popolazione residente (1991) % 36,5 30,1 7,3 4,5 11,4 6,6 3,6 100,0<br />
Variazione demografica 1991-2004 n. in<strong>di</strong>ce - 203,2 472,1 324,6 283,2 147,3 - 128,6 - 361,0 100,0<br />
Densità demografica (2004) n. in<strong>di</strong>ce 1.100,9 304,8 277,6 51,0 49,5 19,1 17,2 100,0<br />
Tasso <strong>di</strong> invecchiamento (2001) n. in<strong>di</strong>ce 105,3 68,3 90,3 109,5 134,2 170,2 208,2 100,0<br />
Tasso <strong>di</strong> attività (2001) n. in<strong>di</strong>ce 98,3 101,8 100,7 101,6 102,2 95,5 98,5 100,0<br />
Tasso <strong>di</strong> occupazione (2001) n. in<strong>di</strong>ce 92,8 98,5 104,7 104,9 113,2 106,0 113,2 100,0<br />
Tasso <strong>di</strong> <strong>di</strong>soccupazione (2001) n. in<strong>di</strong>ce 115,0 108,8 89,5 91,1 70,8 70,0 59,5 100,0<br />
AGRICOLTURA<br />
Aziende agricole % 4,3 19,9 5,7 8,4 26,0 24,1 11,6 100,0<br />
<strong>di</strong> cui con allevamenti % 0,8 1,9 3,4 8,6 20,7 42,3 22,4 100,0<br />
SAU me<strong>di</strong>a aziendale n. in<strong>di</strong>ce 28,6 43,0 23,6 122,2 83,3 125,9 229,0 100,0<br />
Giornate lav./SAU (me<strong>di</strong>a per ettaro) n. in<strong>di</strong>ce 604,6 229,7 550,1 104,4 105,0 60,7 51,2 100,0<br />
Seminativi n. in<strong>di</strong>ce 109,4 94,4 47,4 125,0 78,8 51,1 167,2 100,0<br />
- cereali n. in<strong>di</strong>ce 14,2 38,2 2,0 56,7 64,9 45,4 236,0 100,0<br />
- ortive n. in<strong>di</strong>ce 610,6 347,5 227,5 409,4 38,7 18,6 13,8 100,0<br />
- foraggere n. in<strong>di</strong>ce 29,1 38,2 14,6 184,6 88,2 69,4 139,2 100,0<br />
- florovivaistiche n. in<strong>di</strong>ce 3.427,7 133,1 755,3 166,1 62,7 11,9 8,9 100,0<br />
- industriali n. in<strong>di</strong>ce 82,7 243,9 1,5 41,2 136,7 1,5 164,3 100,0<br />
- tabacco n. in<strong>di</strong>ce 90,0 212,3 0,8 62,9 147,5 1,7 156,8 100,0<br />
Permanenti n. in<strong>di</strong>ce 145,5 165,4 243,0 99,2 150,0 105,8 22,7 100,0<br />
- vite n. in<strong>di</strong>ce 162,8 52,1 409,1 34,6 251,9 63,6 40,0 100,0<br />
- olivo n. in<strong>di</strong>ce 34,4 33,7 173,0 102,2 104,0 172,2 34,5 100,0<br />
- fruttiferi n. in<strong>di</strong>ce 192,2 344,6 139,0 122,1 162,8 57,5 4,0 100,0<br />
- agrumi n. in<strong>di</strong>ce 1.215,7 389,5 2.219,0 92,4 21,4 24,5 0,6 100,0<br />
Prati e pascoli n. in<strong>di</strong>ce 4,0 12,1 13,4 35,7 77,0 218,8 45,4 100,0<br />
Arboricoltura da legno n. in<strong>di</strong>ce 20,2 42,3 12,1 100,6 105,2 147,5 43,3 100,0<br />
Altre superfici n. in<strong>di</strong>ce 145,6 71,8 104,5 100,9 98,1 119,3 75,1 100,0<br />
Zootecnia<br />
- Bovini n. in<strong>di</strong>ce 17,5 16,0 53,2 34,3 586,7 108,0 220,3 100,0<br />
- Bufalini n. in<strong>di</strong>ce 15,0 31,3 0,6 312,5 181,5 26,5 0,4 100,0<br />
- Suini n. in<strong>di</strong>ce 40,7 38,4 65,7 10,6 755,1 89,7 201,5 100,0<br />
- Ovi-caprini n. in<strong>di</strong>ce 8,4 18,8 22,1 16,7 516,9 126,3 254,2 100,0<br />
- Avi-cunicoli n. in<strong>di</strong>ce 35,9 218,5 37,1 18,0 310,5 44,0 187,5 100,0<br />
STRUTTURA ECONOMICA (U.L.)<br />
Agricoltura, silvicoltura e pesca % 4,3 19,9 5,7 8,4 26,0 24,1 11,6 100,0<br />
Industria % 28,0 32,5 7,9 4,4 14,0 8,5 4,6 100,0<br />
- <strong>di</strong> cui trasf. agroalimentare n. in<strong>di</strong>ce 23,9 29,6 9,5 6,2 15,3 10,1 5,2 100,0<br />
- <strong>di</strong> cui costruzioni n. in<strong>di</strong>ce 22,9 35,4 7,9 4,8 14,2 10,0 5,0 100,0<br />
Servizi % 38,1 27,4 8,0 4,6 11,8 6,9 3,3 100,0<br />
<strong>di</strong> cui commercio, alberghi,<br />
- trasporti n. in<strong>di</strong>ce 35,8 29,3 8,6 4,7 11,0 7,3 3,2 100,0<br />
-<br />
<strong>di</strong> cui interm. finanziaria, attività<br />
immobiliari e impren<strong>di</strong>toriali n. in<strong>di</strong>ce 45,3 23,9 6,5 3,8 12,3 5,4 2,8 100,0<br />
- <strong>di</strong> cui altri servizi n. in<strong>di</strong>ce 36,6 26,0 7,7 4,9 13,7 7,4 3,8 100,0<br />
PSR <strong>2007</strong>- <strong>2013</strong> della <strong>Regione</strong> <strong>Campania</strong> - Reg. (CE) n. 1698/2005<br />
Rev_3.1_2008<br />
77