informatoregennaio2010 - Unione del Commercio di Milano
informatoregennaio2010 - Unione del Commercio di Milano
informatoregennaio2010 - Unione del Commercio di Milano

You also want an ePaper? Increase the reach of your titles
YUMPU automatically turns print PDFs into web optimized ePapers that Google loves.
Economico<br />
gennaio 2010<br />
In<strong>di</strong>catori statistici<br />
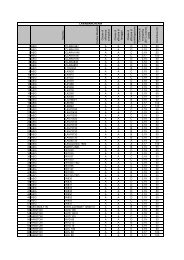
INDICI DEL VALORE DELLE VENDITE DEL COMMERCIO FISSO AL DETTAGLIO A PREZZI CORRENTI<br />
(base 2005=100) per settore merceologico e forma <strong>di</strong>stributiva<br />
Periodo Alimentari Non alimentari Totale<br />
2007<br />
Grande Piccole Grande Piccole Grande Piccole<br />
<strong>di</strong>stribuzione superfici <strong>di</strong>stribuzione superfici <strong>di</strong>stribuzione superfici<br />
Gennaio 95,0 92,5 97,1 96,4 96,1 95,6<br />
Febbraio 89,4 85,8 91,4 86,5 90,5 86,3<br />
Marzo 103,2 95,2 96,5 94,6 99,5 94,7<br />
Aprile 103,2 98,1 93,2 93,7 97,7 94,6<br />
Maggio 104,5 101,2 90,3 99,3 96,7 99,7<br />
Giugno 102,9 99,8 98,5 99 100,5 99,1<br />
Luglio 103,1 105,7 107,4 105,2 105,5 105,3<br />
Agosto 100,0 100,5 93,8 86,9 96,6 89,6<br />
Settembre 104,7 96,1 103,3 99,6 103,9 98,9<br />
Ottobre 105,9 102,6 104,8 106,3 105,3 105,6<br />
Novembre 108,0 94,8 104,1 100,7 105,9 99,5<br />
Dicembre 139,9 136,4 186,7 150,5 165,4 147,7<br />
2008<br />
Gennaio 97,1 93,7 98,2 97,6 97,7 96,9<br />
Febbraio 94,6 88,3 96,2 88,2 95,4 88,2<br />
Marzo 106,0 98,6 96,9 91,1 101,0 92,6<br />
Aprile 104,9 101,3 95,2 91,0 99,6 93,1<br />
Maggio 111,1 101,2 95,4 97,2 102,6 98,0<br />
Giugno 102,2 94,7 98,0 94,3 99,9 94,4<br />
Luglio 107,9 106,9 111,8 106,0 110,0 106,2<br />
Agosto 101,9 98,6 92,7 82,6 96,9 85,8<br />
Settembre 106,1 96,1 103,9 99,0 104,9 98,4<br />
Ottobre 109,6 101,2 104,8 104,1 107,0 103,5<br />
Novembre 108,4 91,1 103,6 96,3 105,8 95,3<br />
Dicembre 138,7 134,2 182,7 146,6 162,7 144,1<br />
2009<br />
Gennaio 98,7 89,8 102,3 97,0 100,7 95,6<br />
Febbraio 92,6 83,8 93,2 82,5 93,0 82,7<br />
Marzo 100,9 92,6 93,9 87,0 97,1 88,1<br />
Aprile 109,3 101,7 96,7 88,2 102,5 90,9<br />
Maggio 110,0 96,0 95,6 93,9 102,1 94,3<br />
Giugno 102,8 92,5 98,0 93,1 100,2 93,0<br />
Luglio 106,6 103,1 111,1 102,1 109,1 102,3<br />
Agosto 99,7 94,8 90,4 80,1 94,6 83,0<br />
Settembre 106,0 92,8 103,7 96,7 104,8 95,9<br />
Nota in<strong>di</strong>ce ven<strong>di</strong>te<br />
A partire dagli in<strong>di</strong>ci <strong>di</strong> Gennaio 2009 l’Istat ha aggiornato la base all’anno 2005, ricalcolando i valori degli anni precedenti che quin<strong>di</strong> sono pubblicati a<br />
partire da Gennaio 2007.<br />
La classificazione per numero <strong>di</strong> addetti non contempla più le classi relative alle imprese più piccole (fino a 2 addetti, da 3 a 5 addetti, da 6 a 9 addetti) e,<br />
quin<strong>di</strong>, la relativa tabella è stata sostituita con quella che <strong>di</strong>stingue tra “Grande <strong>di</strong>stribuzione” e “Piccole superfici”.<br />
Con il termine “Grande <strong>di</strong>stribuzione” si devono intendere le imprese che gestiscono supermercati, ipermercati, <strong>di</strong>scount, gran<strong>di</strong> magazzini e gran<strong>di</strong> superfici<br />
specializzate.<br />
Con il termine “Piccole superfici” si devono intendere i punti <strong>di</strong> ven<strong>di</strong>ta specializzati inferiori a 400mq per gli esercizi a prevalente ven<strong>di</strong>ta non alimentare,<br />
inferiori a 250mq per gli esercizi a prevalente ven<strong>di</strong>ta alimentare.<br />
Si utilizzano i dati grezzi <strong>del</strong> comunicato <strong>del</strong> mese corrente. Il mese successivo l’Istat li ricalcola per cui nel secondo mese si inseriscono i dati grezzi dal comunicato<br />
e si correggono i dati <strong>del</strong> mese precedente con i dati ricalcolati da Istat prendendoli dalle serie storiche <strong>del</strong> mese corrente.<br />
96