Asbestos Fibers and Other Elongate Mineral Particles: State of the ...
Asbestos Fibers and Other Elongate Mineral Particles: State of the ...
Asbestos Fibers and Other Elongate Mineral Particles: State of the ...
- No tags were found...

You also want an ePaper? Increase the reach of your titles
YUMPU automatically turns print PDFs into web optimized ePapers that Google loves.
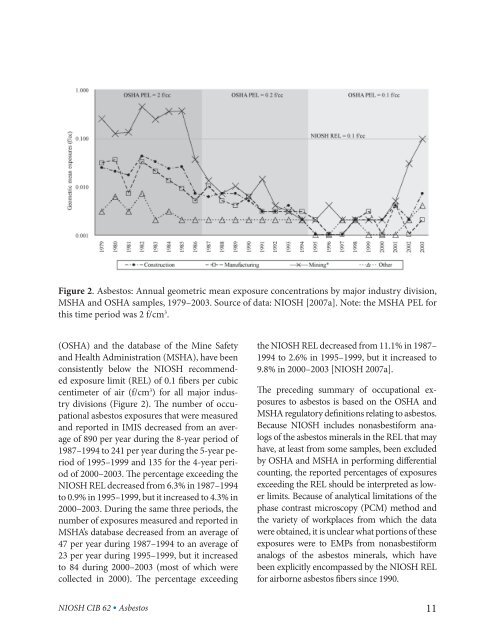
Figure 2. <strong>Asbestos</strong>: Annual geometric mean exposure concentrations by major industry division,<br />
MSHA <strong>and</strong> OSHA samples, 1979–2003. Source <strong>of</strong> data: NIOSH [2007a]. Note: <strong>the</strong> MSHA PEL for<br />
this time period was 2 f/cm 3 .<br />
(OSHA) <strong>and</strong> <strong>the</strong> database <strong>of</strong> <strong>the</strong> Mine Safety<br />
<strong>and</strong> Health Administration (MSHA), have been<br />
consistently below <strong>the</strong> NIOSH recommended<br />
exposure limit (REL) <strong>of</strong> 0.1 fibers per cubic<br />
centimeter <strong>of</strong> air (f/cm 3 ) for all major industry<br />
divisions (Figure 2). The number <strong>of</strong> occupational<br />
asbestos exposures that were measured<br />
<strong>and</strong> reported in IMIS decreased from an average<br />
<strong>of</strong> 890 per year during <strong>the</strong> 8-year period <strong>of</strong><br />
1987–1994 to 241 per year during <strong>the</strong> 5-year period<br />
<strong>of</strong> 1995–1999 <strong>and</strong> 135 for <strong>the</strong> 4-year period<br />
<strong>of</strong> 2000–2003. The percentage exceeding <strong>the</strong><br />
NIOSH REL decreased from 6.3% in 1987–1994<br />
to 0.9% in 1995–1999, but it increased to 4.3% in<br />
2000–2003. During <strong>the</strong> same three periods, <strong>the</strong><br />
number <strong>of</strong> exposures measured <strong>and</strong> reported in<br />
MSHA’s database decreased from an average <strong>of</strong><br />
47 per year during 1987–1994 to an average <strong>of</strong><br />
23 per year during 1995–1999, but it increased<br />
to 84 during 2000–2003 (most <strong>of</strong> which were<br />
collected in 2000). The percentage exceeding<br />
NIOSH CIB 62 • <strong>Asbestos</strong><br />
<strong>the</strong> NIOSH REL decreased from 11.1% in 1987–<br />
1994 to 2.6% in 1995–1999, but it increased to<br />
9.8% in 2000–2003 [NIOSH 2007a].<br />
The preceding summary <strong>of</strong> occupational exposures<br />
to asbestos is based on <strong>the</strong> OSHA <strong>and</strong><br />
MSHA regulatory definitions relating to asbestos.<br />
Because NIOSH includes nonasbestiform analogs<br />
<strong>of</strong> <strong>the</strong> asbestos minerals in <strong>the</strong> REL that may<br />
have, at least from some samples, been excluded<br />
by OSHA <strong>and</strong> MSHA in performing differential<br />
counting, <strong>the</strong> reported percentages <strong>of</strong> exposures<br />
exceeding <strong>the</strong> REL should be interpreted as lower<br />
limits. Because <strong>of</strong> analytical limitations <strong>of</strong> <strong>the</strong><br />
phase contrast microscopy (PCM) method <strong>and</strong><br />
<strong>the</strong> variety <strong>of</strong> workplaces from which <strong>the</strong> data<br />
were obtained, it is unclear what portions <strong>of</strong> <strong>the</strong>se<br />
exposures were to EMPs from nonasbestiform<br />
analogs <strong>of</strong> <strong>the</strong> asbestos minerals, which have<br />
been explicitly encompassed by <strong>the</strong> NIOSH REL<br />
for airborne asbestos fibers since 1990.<br />
11