the world of organic agriculture - Organic Eprints
the world of organic agriculture - Organic Eprints
the world of organic agriculture - Organic Eprints
You also want an ePaper? Increase the reach of your titles
YUMPU automatically turns print PDFs into web optimized ePapers that Google loves.
122<br />
The World <strong>of</strong> <strong>Organic</strong> Agriculture 2006<br />
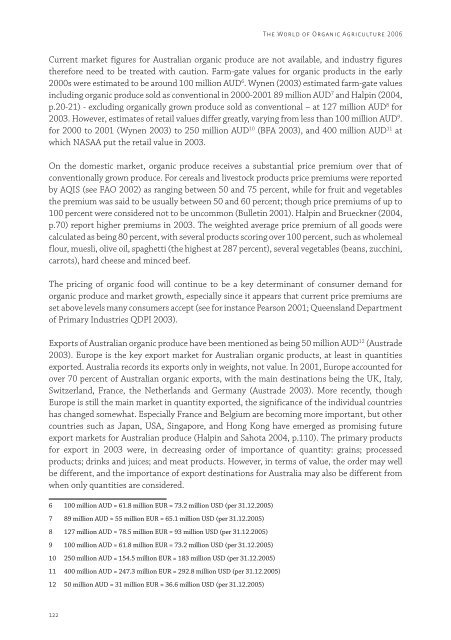
Current market figures for Australian <strong>organic</strong> produce are not available, and industry figures<br />
<strong>the</strong>refore need to be treated with caution. Farm-gate values for <strong>organic</strong> products in <strong>the</strong> early<br />
2000s were estimated to be around 100 million AUD 6 . Wynen (2003) estimated farm-gate values<br />
including <strong>organic</strong> produce sold as conventional in 2000-2001 89 million AUD 7 and Halpin (2004,<br />
p.20-21) - excluding <strong>organic</strong>ally grown produce sold as conventional – at 127 million AUD 8 for<br />
2003. However, estimates <strong>of</strong> retail values differ greatly, varying from less than 100 million AUD 9 .<br />
for 2000 to 2001 (Wynen 2003) to 250 million AUD 10 (BFA 2003), and 400 million AUD 11 at<br />
which NASAA put <strong>the</strong> retail value in 2003.<br />
On <strong>the</strong> domestic market, <strong>organic</strong> produce receives a substantial price premium over that <strong>of</strong><br />
conventionally grown produce. For cereals and livestock products price premiums were reported<br />
by AQIS (see FAO 2002) as ranging between 50 and 75 percent, while for fruit and vegetables<br />
<strong>the</strong> premium was said to be usually between 50 and 60 percent; though price premiums <strong>of</strong> up to<br />
100 percent were considered not to be uncommon (Bulletin 2001). Halpin and Brueckner (2004,<br />
p.70) report higher premiums in 2003. The weighted average price premium <strong>of</strong> all goods were<br />
calculated as being 80 percent, with several products scoring over 100 percent, such as wholemeal<br />
flour, muesli, olive oil, spaghetti (<strong>the</strong> highest at 287 percent), several vegetables (beans, zucchini,<br />
carrots), hard cheese and minced beef.<br />
The pricing <strong>of</strong> <strong>organic</strong> food will continue to be a key determinant <strong>of</strong> consumer demand for<br />
<strong>organic</strong> produce and market growth, especially since it appears that current price premiums are<br />
set above levels many consumers accept (see for instance Pearson 2001; Queensland Department<br />
<strong>of</strong> Primary Industries QDPI 2003).<br />
Exports <strong>of</strong> Australian <strong>organic</strong> produce have been mentioned as being 50 million AUD 12 (Austrade<br />
2003). Europe is <strong>the</strong> key export market for Australian <strong>organic</strong> products, at least in quantities<br />
exported. Australia records its exports only in weights, not value. In 2001, Europe accounted for<br />
over 70 percent <strong>of</strong> Australian <strong>organic</strong> exports, with <strong>the</strong> main destinations being <strong>the</strong> UK, Italy,<br />
Switzerland, France, <strong>the</strong> Ne<strong>the</strong>rlands and Germany (Austrade 2003). More recently, though<br />
Europe is still <strong>the</strong> main market in quantity exported, <strong>the</strong> significance <strong>of</strong> <strong>the</strong> individual countries<br />
has changed somewhat. Especially France and Belgium are becoming more important, but o<strong>the</strong>r<br />
countries such as Japan, USA, Singapore, and Hong Kong have emerged as promising future<br />
export markets for Australian produce (Halpin and Sahota 2004, p.110). The primary products<br />
for export in 2003 were, in decreasing order <strong>of</strong> importance <strong>of</strong> quantity: grains; processed<br />
products; drinks and juices; and meat products. However, in terms <strong>of</strong> value, <strong>the</strong> order may well<br />
be different, and <strong>the</strong> importance <strong>of</strong> export destinations for Australia may also be different from<br />
when only quantities are considered.<br />
6 100 million AUD = 61.8 million EUR = 73.2 million USD (per 31.12.2005)<br />
7 89 million AUD = 55 million EUR = 65.1 million USD (per 31.12.2005)<br />
8 127 million AUD = 78.5 million EUR = 93 million USD (per 31.12.2005)<br />
9 100 million AUD = 61.8 million EUR = 73.2 million USD (per 31.12.2005)<br />
10 250 million AUD = 154.5 million EUR = 183 million USD (per 31.12.2005)<br />
11 400 million AUD = 247.3 million EUR = 292.8 million USD (per 31.12.2005)<br />
12 50 million AUD = 31 million EUR = 36.6 million USD (per 31.12.2005)


