- Page 1 and 2:
I "a f IMods Hole '" ~ o c.,,~tlOGR
- Page 3 and 4: ) )
- Page 5 and 6: " \ / )
- Page 7 and 8: parent sediment on the eastern oute
- Page 9 and 10: esearch. 5 )
- Page 11 and 12: Res u 1 ts. . . . . . . . . . . . .
- Page 13 and 14: Figure 3.12 Echo-sounding profile (
- Page 15 and 16: Fi gure 6.14 6. 15 7. 1 7.2 7.3 7.4
- Page 17 and 18: \ I ) Table 4. 1 4.2 5.1 5.2 5.3 6.
- Page 19 and 20: CHAPTER I INTRODUCTION The area inv
- Page 21 and 22: ) \ .1 Fi gure i. 1. Bathymetry of
- Page 23 and 24: ~. ~ 71° 70° tI 68 fJ0 25° 7' 25
- Page 25 and 26: ) ) This is expected since most of
- Page 27: GENERAL DES CRI PT I ON CHAPTE R I
- Page 30 and 31: j
- Page 32 and 33: egi onal contours. An area centered
- Page 34 and 35: this region. However, all of these
- Page 36 and 37: ) ì /
- Page 38 and 39: ') ) ) /
- Page 41 and 42: '"-, i~ 7t 70° 6f 68 67° 25° 72
- Page 43: Fig u r e 3. 2 . CON RA D 10 s e is
- Page 46 and 47: sequence corresponds to layered tur
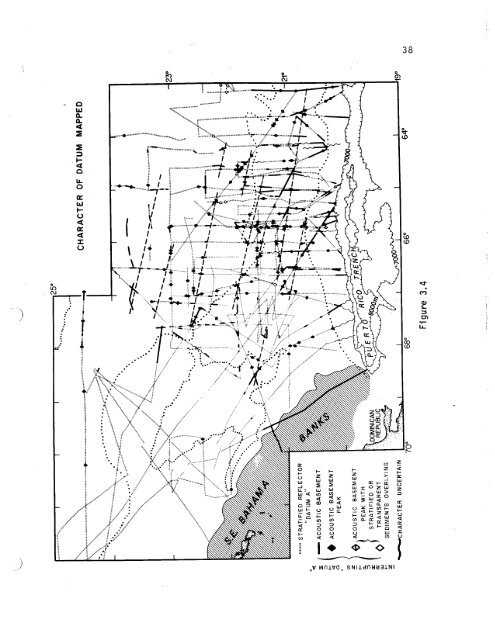
- Page 49: ) . .) Figure 3.3. Map showing domi
- Page 52 and 53: \ )
- Page 56 and 57: still locally break through the str
- Page 58 and 59: \ / )
- Page 60 and 61: \ j
- Page 62 and 63: ) )
- Page 64 and 65: ) )
- Page 66 and 67: sector of the outer ridge, but it i
- Page 68 and 69: \ /
- Page 70 and 71: Datum A is frequently interrupted b
- Page 72 and 73: ) )
- Page 74 and 75: ) )
- Page 76 and 77: approximately equal to sediment thi
- Page 78 and 79: ; ) . )
- Page 80 and 81: ) )
- Page 82 and 83: sea floor are observed only in the
- Page 84 and 85: , )
- Page 86 and 87: i\ j )
- Page 88 and 89: ) ) j
- Page 90 and 91: .., I j ) j
- Page 92 and 93: \ ) )
- Page 94 and 95: \ i )
- Page 96 and 97: ') ./ j
- Page 98 and 99: The transparent layer represents se
- Page 100 and 101: l ~"\ I / )
- Page 102 and 103: ) )
- Page 105 and 106:
\ i / Figure 4.2. Grain-size distri
- Page 107 and 108:
..) o l. oC\ o U A. o ~ . 1f ci Z ~
- Page 109 and 110:
) Figure 4.3. Organic carbon in two
- Page 111 and 112:
\ '-~ '~-,~/ ORGANIC CARBON (%) , 2
- Page 113 and 114:
, ) ) Figure 4.4. Bottom photograph
- Page 115 and 116:
i u 4,4 75
- Page 117 and 118:
\ ) ) Figure 4.5. Distal turbidite
- Page 119 and 120:
Figure 4,5 78
- Page 121 and 122:
) ) Figure 4.6. General 1 i thol og
- Page 123 and 124:
~' ',,. O. d1 A 17 A c! ----- ¿J6
- Page 125:
) TH E CARBONATES Foraminiferal tes
- Page 128 and 129:
') '-~/' ) :;"
- Page 130 and 131:
) ) /
- Page 133 and 134:
) ) ~U E ~ a. ~ U LO ~ METERS o N v
- Page 135 and 136:
;'", : ) j fraction of the foramini
- Page 137 and 138:
) ) Diffractograms of the lutite fr
- Page 139 and 140:
'-j \_-- TABLE 4.1. MINERALOGY OF T
- Page 141 and 142:
) . ì ) of North America have clay
- Page 143 and 144:
\ ) ) Figure 4.9. Chlorite abundanc
- Page 145 and 146:
) ) CHLORITE (c:2 tLm) WEIGHTED PEA
- Page 147 and 148:
) ) Figure 4.10. Chlorite abundance
- Page 149 and 150:
" ~ ) ) 80° 70° 60° i 0 No i I .
- Page 151 and 152:
: ) ) abundances (Biscaye, 1965; Ra
- Page 153 and 154:
'"'/ '-/ TABLE 4.2. M I N E RA LOG
- Page 155 and 156:
) ) deep-sea areas), the sediment m
- Page 157 and 158:
) ) REGIONAL PATTERNS CHAPTE R V CH
- Page 159 and 160:
) ) Pliocene/Pleistocene boundary.
- Page 161 and 162:
¡~ , J ,) 109 Figure 5.1. Percent
- Page 163 and 164:
~.. G RC 8-129 CH 3S VIS-17 , HP 0
- Page 165 and 166:
, ) ) ,J ) W through Z zones in the
- Page 167 and 168:
. j near-surface samples: 1) the wi
- Page 169 and 170:
) ) i 16
- Page 171 and 172:
) Figure 5.2. Ages and general lith
- Page 173 and 174:
",-/ ,~~ CH 57-4 w zwuow CH 57-12 C
- Page 175 and 176:
) ~-: , Puerto Rico Trench has rece
- Page 177 and 178:
. ) ) ) ~. WATER MASSES CHAPTER VI
- Page 179 and 180:
) i~J 123 The NADW overlying th~ AA
- Page 181 and 182:
'--. '~¿ TABLE 6.1. SUMMARY OF CUR
- Page 183 and 184:
) , Fi gure 6.1. Bathymetri c map o
- Page 185 and 186:
'~. tU 68 6JO 25° 63° 24° 24° 2
- Page 187 and 188:
) ) 130 the fine-grained sediment ~
- Page 189 and 190:
) ì ~ Figure 6.2. Potential-temper
- Page 191 and 192:
) l" (W) H.Ld30 0 0 0 0 0 0 0 to 0
- Page 193 and 194:
~ ~ en flU) H.1d30 0 0 0 0 0 II 0 0
- Page 195 and 196:
) j) 3 An: 1845 ------ POTENTIAL TE
- Page 197 and 198:
) ) STA An 1835 POTENTIAL TEMPERATU
- Page 199 and 200:
~ ) ~ v in in in lO in ~ in ~ ~ 0 v
- Page 201 and 202:
''' \-." PO TEN T/A L TEMPERATURE
- Page 203 and 204:
, ) ) 139 Figure 6.3. Potential tem
- Page 205 and 206:
. "- \ '-_/ 60° . . " . ,. .. . .
- Page 207 and 208:
) \ ) At Station 1826, twenty-two k
- Page 209 and 210:
) 143 Figure 6.4. Traces of potenti
- Page 211 and 212:
) ) -. ~ 4000 4500 ~ 5000 ~ c: 5500
- Page 213:
) ) 146 Figure 6.5. Diagram of pote
- Page 216 and 217:
The silicate values plotted against
- Page 218 and 219:
\ / \ í --_/
- Page 220 and 221:
Secti on 1 (Crest) TABLE 6.2. CALCU
- Page 222 and 223:
eference level above the crest of t
- Page 224 and 225:
\ ) )
- Page 226 and 227:
156 substantial flow not indicated
- Page 228 and 229:
'ì j .)
- Page 230 and 231:
) ) ./
- Page 232 and 233:
) )
- Page 235 and 236:
) \ j Lf ¡ ii~ l1 .. ~õ .. g~ -z
- Page 237:
. ) ) Figure 6.10. Progressi ve vec
- Page 240 and 241:
oad opposing flows, one to the WNW
- Page 242 and 243:
) .)
- Page 244 and 245:
InN 0 ve m b e r, 1 9 7 1, a s e co
- Page 246 and 247:
., J , l -j
- Page 248 and 249:
progressive vector diagrams (Fig. 6
- Page 250 and 251:
(Fig. 6.13). The strongest currents
- Page 252 and 253:
)/ )
- Page 254 and 255:
\ I / \ j
- Page 257 and 258:
Figure 6.14 176
- Page 259 and 260:
) ) Greater Antilles Outer Ridge, a
- Page 261 and 262:
) ) Figure 6.15. i 79 Summary of di
- Page 263 and 264:
Fig u re 6. i 5 180
- Page 265 and 266:
) , ! j INTRODUCTION CHAPTER VI I S
- Page 267 and 268:
) ) Figure 7.1. 183 Locati ons of s
- Page 269 and 270:
\ . I ) ) Fi gure 7. 1 24° NARES 6
- Page 271:
, ,J / \ j 186 Figure 7.2. Light-sc
- Page 274 and 275:
has been di scussed. As poi nted ou
- Page 276 and 277:
\ ) l j
- Page 278 and 279:
191 Fig. 6. 2) i son 1 y a b 0 u to
- Page 280 and 281:
12 pg/liter, compared with an avera
- Page 282 and 283:
) -)
- Page 285 and 286:
9 u re 7. 4 196
- Page 287 and 288:
) .J Figure 7.5. Scanning e 1 e c t
- Page 289 and 290:
9 u re 7. 5
- Page 291 and 292:
) J thus accounting for this grain
- Page 293 and 294:
) _/ single bottom-sediment sample
- Page 295 and 296:
) ) concentrations when the weighti
- Page 297 and 298:
) ~) ! . 205 Figure 7.6. Relationsh
- Page 299 and 300:
~. \~ SAMPLE THICKNESS (p) 0.45 0.0
- Page 301 and 302:
" ) ) TABLE 7.2. MINERALOGY OF SUSP
- Page 303 and 304:
) / ) Fig u re 7. 7 . 210 X-ray di
- Page 305 and 306:
, ~ .. ,) \ ) " u 211 C\ CD C\ ~ (j
- Page 307 and 308:
) -) 14 cm/sec. 213 The rate of dep
- Page 309 and 310:
) ) J Any extensive erosion on the
- Page 311 and 312:
)/ ) ~ PREVIOUS THEORIES CHAPTER VI
- Page 313 and 314:
) ) 219 Figure 8.1. Schematic sketc
- Page 315 and 316:
ì / \ .) W ZWU0W W -l Cl Cl :i 0 t
- Page 317 and 318:
) . ) -~ sediment types and to laye
- Page 319 and 320:
) ) there are also other factors wh
- Page 321 and 322:
) , ~ 225 Figure 8.2. Synthesis of
- Page 323 and 324:
) ) / w zwuow w ~ -l o r- w -l o ~
- Page 325 and 326:
'~. ...-- TABLE 8.1. COMPARISON OF
- Page 327:
) \ --) configuration of this pocke
- Page 330:
) )
- Page 333:
) increased flow of AABW westward a
- Page 336 and 337:
1) )
- Page 338 and 339:
sedi ment was bei ng eroded in the
- Page 340 and 341:
, ) .. / )
- Page 342 and 343:
) )
- Page 344 and 345:
241 the Caicos Outer Ridge is suffi
- Page 346 and 347:
De t ail e d com po sit ion a 1 com
- Page 348 and 349:
normally must be determined by cori
- Page 351 and 352:
) ) REFERENCES CITED Amos, A.F. and
- Page 353 and 354:
') 249 Bunce, E. T . ~J . D . Phill
- Page 355 and 356:
) \ ) Fuglister, F.C. (1960) Atlant
- Page 357 and 358:
) ) Kennett, J.P. and P. Huddlestun
- Page 359 and 360:
\ ) ì ./ Reynolds, R.C. and J. How
- Page 361 and 362:
) ) 257 Worthington,L.V. andW.R.Wri
- Page 363 and 364:
.) ~) APPENDIX I SEDIMENT CORES Cor
- Page 365 and 366:
0 Li E 0 +' +' QJ oSa: 0 u +' 1t~0
- Page 367 and 368:
E Q) 0 c -i Q) Q) Q) Q) -i Q) c u 0
- Page 369 and 370:
) / APPENDI X I I BOTTOM PHOTOGRAPH
- Page 371 and 372:
) ) TABLE A2.1. BOTTOM PHOTOGRAPHS
- Page 373 and 374:
TABLE A2.1. BOTTOM PHOTOGRAPHS (Con
- Page 375 and 376:
) TABLE A2.1. BOTTOM PHOTOGRAPHS (C
- Page 377 and 378:
) ) TABLE A2.1. BOTTOM PHOTOGRAPHS
- Page 379 and 380:
) ) CH 36 CH 57 CH 75 KN 25 KN 25 T
- Page 381 and 382:
) / ) KN 25 KN 25 KN 25 LL 8 LL 8 T
- Page 383 and 384:
TABLE A2.1. BOTTOM PHOTOGRAPHS (Con
- Page 385 and 386:
)~J . / ) APPENDIX III SUSPENDED PA
- Page 387 and 388:
) ) s. -i M a LO .. .. Q) -l.. ~ a
- Page 389 and 390:
) ~ .. a i. M N M Q) ~.. M i. .- LO
- Page 391:
\,-/ '-- TABLE A3.1. SUSPENDED PART
- Page 394 and 395:
~ vane which penetrated deeper into
- Page 397 and 398:
~ ) ~ ~ \ ji 0.5 1.0 1.5 2.0 2.5 WA
- Page 399 and 400:
, ) ) 289 Figure A4.2. Plots of wat
- Page 401 and 402:
\. ~ WATER CONTENT (%ORY WT) SHEAR
- Page 403 and 404:
) \ j 291 Figure A4.3. Plots of wat
- Page 405 and 406:
, ',, ~ .~ WATER CONTENT (% DRY WT.
- Page 407:
') ) 293 Figure A4.4. Plots of wate
- Page 410 and 411:
, ) )
- Page 412 and 413:
, ) )
- Page 414 and 415:
'. I ) )
- Page 417 and 418:
) ) ~ ~ ~ WATER CONTENT (%DRY WT) 6
- Page 419 and 420:
) ) Figure A4.7. Plots of water con
- Page 421 and 422:
) Fig u re A4. 7 300
- Page 423 and 424:
) ) ./ 301 Figure A4.8. Plots of wa
- Page 425 and 426:
) ) t\-- §" ~ o ~ ~ ~ ~ ~ V) a Q:
- Page 427 and 428:
) ) Fi g u re A4. 9 . 303 Plots of
- Page 429 and 430:
) ) tI WATER CONTENT (% DRY WT) 60
- Page 431 and 432:
~ ) -) 305 Figure A4.10. Plots of w
- Page 433:
o (/ ) ~ i. l. ~ 12 ) 4 8 16 20 306
- Page 436 and 437:
. I ) .)
- Page 438 and 439:
) )
- Page 441 and 442:
) ) V) ~l. ~ WATER CONTENT (%DRY WT
- Page 443:
) ) 311 Figure A4.13. Plots of wate
- Page 446 and 447:
\ ' ) ) ./
- Page 448 and 449:
Tucholke, B.E., C.D. Hollister, and
- Page 451 and 452:
~' \'~ -i -1. -ater "'ge - f1odsile
- Page 453 and 454:
\ ) ) UNCLASSIFI ED 1/31/74 SECURIT