WBC-VIII-Vol.4 – Resources – Forestry, Plantations and ... - BambuSC
WBC-VIII-Vol.4 – Resources – Forestry, Plantations and ... - BambuSC
WBC-VIII-Vol.4 – Resources – Forestry, Plantations and ... - BambuSC

You also want an ePaper? Increase the reach of your titles
YUMPU automatically turns print PDFs into web optimized ePapers that Google loves.
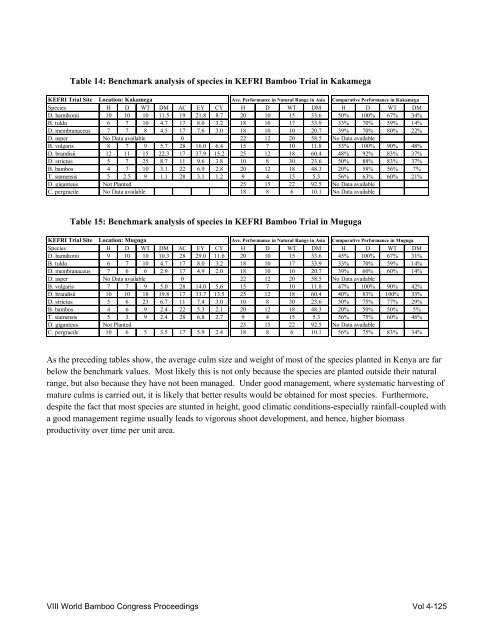
Table 14: Benchmark analysis of species in KEFRI Bamboo Trial in Kakamega<br />
KEFRI Trial Site Location: Kakamega Ave. Performance in Natural Range in Asia Comparative Performance in Kakamega<br />
Species H D WT DM AC EY CY H D WT DM H D WT DM<br />
D. hamiltonii 10 10 10 11.5 19 21.8 8.7 20 10 15 33.6 50% 100% 67% 34%<br />
B. tulda 6 7 10 4.7 17 8.0 3.2 18 10 17 33.9 33% 70% 59% 14%<br />
D. membranaceus 7 7 8 4.5 17 7.6 3.0 18 10 10 20.7 39% 70% 80% 22%<br />
D. asper No Data available 0 22 12 20 58.5 No Data available<br />
B. vulgaris 8 7 9 5.7 28 16.0 6.4 15 7 10 11.8 53% 100% 90% 48%<br />
D. br<strong>and</strong>isii 12 11 15 22.3 17 37.9 15.2 25 12 18 60.4 48% 92% 83% 37%<br />
D. strictus 5 7 25 8.7 11 9.6 3.8 10 8 30 23.6 50% 88% 83% 37%<br />
B. bambos 4 7 10 3.1 22 6.9 2.8 20 12 18 48.3 20% 58% 56% 7%<br />
T. siamensis 5 2.5 9 1.1 28 3.1 1.2 9 4 15 5.3 56% 63% 60% 21%<br />
D. giganteus Not Planted 25 15 22 92.5 No Data available<br />
C. pergracile No Data available 18 8 6 10.1 No Data available<br />
Table 15: Benchmark analysis of species in KEFRI Bamboo Trial in Muguga<br />
KEFRI Trial Site Location: Muguga Ave. Performance in Natural Range in Asia Comparative Performance in Muguga<br />
Species H D WT DM AC EY CY H D WT DM H D WT DM<br />
D. hamiltonii 9 10 10 10.3 28 29.0 11.6 20 10 15 33.6 45% 100% 67% 31%<br />
B. tulda 6 7 10 4.7 17 8.0 3.2 18 10 17 33.9 33% 70% 59% 14%<br />
D. membranaceus 7 6 6 2.9 17 4.9 2.0 18 10 10 20.7 39% 60% 60% 14%<br />
D. asper No Data available 0 22 12 20 58.5 No Data available<br />
B. vulgaris 7 7 9 5.0 28 14.0 5.6 15 7 10 11.8 47% 100% 90% 42%<br />
D. br<strong>and</strong>isii 10 10 18 19.8 17 33.7 13.5 25 12 18 60.4 40% 83% 100% 33%<br />
D. strictus 5 6 23 6.7 11 7.4 3.0 10 8 30 23.6 50% 75% 77% 29%<br />
B. bambos 4 6 9 2.4 22 5.3 2.1 20 12 18 48.3 20% 50% 50% 5%<br />
T. siamensis 5 3 9 2.4 28 6.8 2.7 9 4 15 5.3 56% 75% 60% 46%<br />
D. giganteus Not Planted 25 15 22 92.5 No Data available<br />
C. pergracile 10 6 5 3.5 17 5.9 2.4 18 8 6 10.1 56% 75% 83% 34%<br />
As the preceding tables show, the average culm size <strong>and</strong> weight of most of the species planted in Kenya are far<br />
below the benchmark values. Most likely this is not only because the species are planted outside their natural<br />
range, but also because they have not been managed. Under good management, where systematic harvesting of<br />
mature culms is carried out, it is likely that better results would be obtained for most species. Furthermore,<br />
despite the fact that most species are stunted in height, good climatic conditions-especially rainfall-coupled with<br />
a good management regime usually leads to vigorous shoot development, <strong>and</strong> hence, higher biomass<br />
productivity over time per unit area.<br />
<strong>VIII</strong> World Bamboo Congress Proceedings Vol 4-125