Crossroads: The Psychology of Immigration in the New Century
Crossroads: The Psychology of Immigration in the New Century
Crossroads: The Psychology of Immigration in the New Century

Create successful ePaper yourself
Turn your PDF publications into a flip-book with our unique Google optimized e-Paper software.
demographic Contours <strong>of</strong> <strong>the</strong> U.s.<br />
Immigrant-orig<strong>in</strong> Population<br />
Historical and International Perspectives on <strong>Immigration</strong><br />
In <strong>the</strong> 21st century, millions <strong>of</strong> people around <strong>the</strong> world<br />
are be<strong>in</strong>g affected by <strong>the</strong> experience <strong>of</strong> migration—214<br />
million as transnational migrants and many millions more as<br />
immediate relatives left beh<strong>in</strong>d (UNDP, 2010). <strong>Immigration</strong><br />
is transform<strong>in</strong>g nations <strong>the</strong> world over. <strong>The</strong> average<br />
percentage <strong>of</strong> immigrants <strong>in</strong> “more developed” nations is 7<br />
times higher than <strong>the</strong> percentage <strong>in</strong> “less developed” nations<br />
(10.3% vs. 1.5%) (C. Suárez-Orozco, 2004).<br />
<strong>The</strong> United States has more than 3 times <strong>the</strong> number <strong>of</strong><br />
immigrants than <strong>the</strong> Russian Federation—<strong>the</strong> country<br />
with <strong>the</strong> next largest number. Every year s<strong>in</strong>ce 1990,<br />
approximately one million new immigrants have entered<br />
<strong>the</strong> United States. Approximately 17 million (43%)<br />
foreign-born persons currently liv<strong>in</strong>g <strong>in</strong> <strong>the</strong> United States<br />
are naturalized citizens, ano<strong>the</strong>r 11 million (28%) are<br />
authorized noncitizens, and <strong>the</strong> rema<strong>in</strong><strong>in</strong>g 11 million (28%)<br />
are undocumented (CBO, 2011). Notably, after 3 decades<br />
<strong>of</strong> cont<strong>in</strong>uous growth, <strong>the</strong> undocumented immigrant<br />
populations have decreased by approximately one million<br />
dur<strong>in</strong>g <strong>the</strong> last 2 years follow<strong>in</strong>g <strong>the</strong> onset <strong>of</strong> <strong>the</strong> economic<br />
downturn that began <strong>in</strong> late 2007 (Hoefer, Ryt<strong>in</strong>a, & Baker,<br />
2009).<br />
While <strong>the</strong> absolute number <strong>of</strong> immigrants <strong>in</strong> <strong>the</strong> United<br />
States is at an all-time high, <strong>the</strong> rate <strong>of</strong> immigration today<br />
<strong>The</strong> Why and Who <strong>of</strong> <strong>Immigration</strong><br />
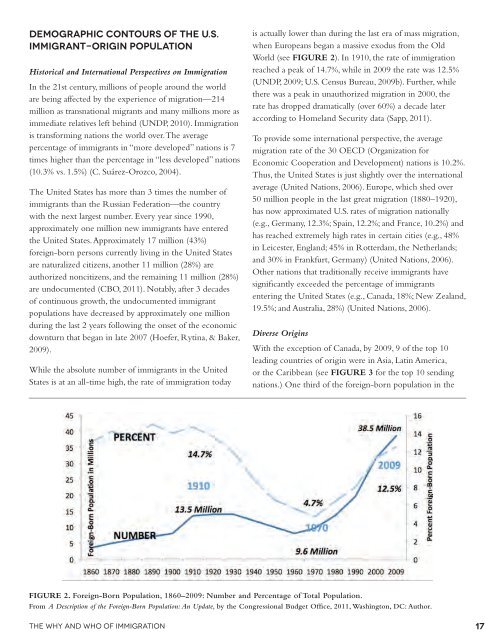
is actually lower than dur<strong>in</strong>g <strong>the</strong> last era <strong>of</strong> mass migration,<br />
when Europeans began a massive exodus from <strong>the</strong> Old<br />
World (see FIGURE 2). In 1910, <strong>the</strong> rate <strong>of</strong> immigration<br />
reached a peak <strong>of</strong> 14.7%, while <strong>in</strong> 2009 <strong>the</strong> rate was 12.5%<br />
(UNDP, 2009; U.S. Census Bureau, 2009b). Fur<strong>the</strong>r, while<br />
<strong>the</strong>re was a peak <strong>in</strong> unauthorized migration <strong>in</strong> 2000, <strong>the</strong><br />
rate has dropped dramatically (over 60%) a decade later<br />
accord<strong>in</strong>g to Homeland Security data (Sapp, 2011).<br />
To provide some <strong>in</strong>ternational perspective, <strong>the</strong> average<br />
migration rate <strong>of</strong> <strong>the</strong> 30 OECD (Organization for<br />
Economic Cooperation and Development) nations is 10.2%.<br />
Thus, <strong>the</strong> United States is just slightly over <strong>the</strong> <strong>in</strong>ternational<br />
average (United Nations, 2006). Europe, which shed over<br />
50 million people <strong>in</strong> <strong>the</strong> last great migration (1880–1920),<br />
has now approximated U.S. rates <strong>of</strong> migration nationally<br />
(e.g., Germany, 12.3%; Spa<strong>in</strong>, 12.2%; and France, 10.2%) and<br />
has reached extremely high rates <strong>in</strong> certa<strong>in</strong> cities (e.g., 48%<br />
<strong>in</strong> Leicester, England; 45% <strong>in</strong> Rotterdam, <strong>the</strong> Ne<strong>the</strong>rlands;<br />
and 30% <strong>in</strong> Frankfurt, Germany) (United Nations, 2006).<br />
O<strong>the</strong>r nations that traditionally receive immigrants have<br />
significantly exceeded <strong>the</strong> percentage <strong>of</strong> immigrants<br />
enter<strong>in</strong>g <strong>the</strong> United States (e.g., Canada, 18%; <strong>New</strong> Zealand,<br />
19.5%; and Australia, 28%) (United Nations, 2006).<br />
Diverse Orig<strong>in</strong>s<br />
With <strong>the</strong> exception <strong>of</strong> Canada, by 2009, 9 <strong>of</strong> <strong>the</strong> top 10<br />
lead<strong>in</strong>g countries <strong>of</strong> orig<strong>in</strong> were <strong>in</strong> Asia, Lat<strong>in</strong> America,<br />
or <strong>the</strong> Caribbean (see FIGURE 3 for <strong>the</strong> top 10 send<strong>in</strong>g<br />
nations.) One third <strong>of</strong> <strong>the</strong> foreign-born population <strong>in</strong> <strong>the</strong><br />
FIGURE 2. foreign-Born Population, 1860–2009: number and Percentage <strong>of</strong> Total Population.<br />
from A Description <strong>of</strong> <strong>the</strong> Foreign-Born Population: An Update, by <strong>the</strong> congressional Budget <strong>of</strong>fice, 2011, wash<strong>in</strong>gton, Dc: author.<br />
17