Crossroads: The Psychology of Immigration in the New Century
Crossroads: The Psychology of Immigration in the New Century
Crossroads: The Psychology of Immigration in the New Century

Create successful ePaper yourself
Turn your PDF publications into a flip-book with our unique Google optimized e-Paper software.
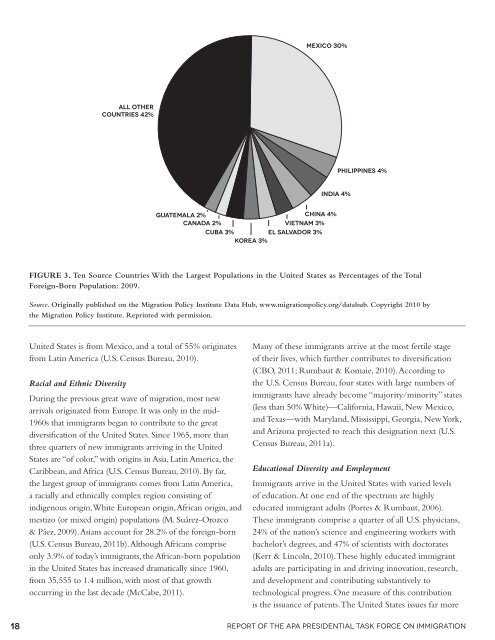
All o<strong>the</strong>r<br />
countries 42%<br />
FIGURE 3. Ten source countries with <strong>the</strong> largest Populations <strong>in</strong> <strong>the</strong> united states as Percentages <strong>of</strong> <strong>the</strong> Total<br />
foreign-Born Population: 2009.<br />
Source. orig<strong>in</strong>ally published on <strong>the</strong> migration Policy Institute Data hub, www.migrationpolicy.org/datahub. copyright 2010 by<br />
<strong>the</strong> migration Policy Institute. repr<strong>in</strong>ted with permission.<br />
United States is from Mexico, and a total <strong>of</strong> 55% orig<strong>in</strong>ates<br />
from Lat<strong>in</strong> America (U.S. Census Bureau, 2010).<br />
Racial and Ethnic Diversity<br />
Dur<strong>in</strong>g <strong>the</strong> previous great wave <strong>of</strong> migration, most new<br />
arrivals orig<strong>in</strong>ated from Europe. It was only <strong>in</strong> <strong>the</strong> mid-<br />
1960s that immigrants began to contribute to <strong>the</strong> great<br />
diversification <strong>of</strong> <strong>the</strong> United States. S<strong>in</strong>ce 1965, more than<br />
three quarters <strong>of</strong> new immigrants arriv<strong>in</strong>g <strong>in</strong> <strong>the</strong> United<br />
States are “<strong>of</strong> color,” with orig<strong>in</strong>s <strong>in</strong> Asia, Lat<strong>in</strong> America, <strong>the</strong><br />
Caribbean, and Africa (U.S. Census Bureau, 2010). By far,<br />
<strong>the</strong> largest group <strong>of</strong> immigrants comes from Lat<strong>in</strong> America,<br />
a racially and ethnically complex region consist<strong>in</strong>g <strong>of</strong><br />
<strong>in</strong>digenous orig<strong>in</strong>, White European orig<strong>in</strong>, African orig<strong>in</strong>, and<br />
mestizo (or mixed orig<strong>in</strong>) populations (M. Suárez-Orozco<br />
& Páez, 2009). Asians account for 28.2% <strong>of</strong> <strong>the</strong> foreign-born<br />
(U.S. Census Bureau, 2011b). Although Africans comprise<br />
only 3.9% <strong>of</strong> today’s immigrants, <strong>the</strong> African-born population<br />
<strong>in</strong> <strong>the</strong> United States has <strong>in</strong>creased dramatically s<strong>in</strong>ce 1960,<br />
from 35,555 to 1.4 million, with most <strong>of</strong> that growth<br />
occurr<strong>in</strong>g <strong>in</strong> <strong>the</strong> last decade (McCabe, 2011).<br />
Mexico 30%<br />
India 4%<br />
Guatemala 2%<br />
Ch<strong>in</strong>a 4%<br />
Canada 2%<br />
Vietnam 3%<br />
Cuba 3%<br />
El Salvador 3%<br />
Korea 3%<br />
Philipp<strong>in</strong>es 4%<br />
Many <strong>of</strong> <strong>the</strong>se immigrants arrive at <strong>the</strong> most fertile stage<br />
<strong>of</strong> <strong>the</strong>ir lives, which fur<strong>the</strong>r contributes to diversification<br />
(CBO, 2011; Rumbaut & Komaie, 2010). Accord<strong>in</strong>g to<br />
<strong>the</strong> U.S. Census Bureau, four states with large numbers <strong>of</strong><br />
immigrants have already become “majority/m<strong>in</strong>ority” states<br />
(less than 50% White)—California, Hawaii, <strong>New</strong> Mexico,<br />
and Texas—with Maryland, Mississippi, Georgia, <strong>New</strong> York,<br />
and Arizona projected to reach this designation next (U.S.<br />
Census Bureau, 2011a).<br />
Educational Diversity and Employment<br />
Immigrants arrive <strong>in</strong> <strong>the</strong> United States with varied levels<br />
<strong>of</strong> education. At one end <strong>of</strong> <strong>the</strong> spectrum are highly<br />
educated immigrant adults (Portes & Rumbaut, 2006).<br />
<strong>The</strong>se immigrants comprise a quarter <strong>of</strong> all U.S. physicians,<br />
24% <strong>of</strong> <strong>the</strong> nation’s science and eng<strong>in</strong>eer<strong>in</strong>g workers with<br />
bachelor’s degrees, and 47% <strong>of</strong> scientists with doctorates<br />
(Kerr & L<strong>in</strong>coln, 2010). <strong>The</strong>se highly educated immigrant<br />
adults are participat<strong>in</strong>g <strong>in</strong> and driv<strong>in</strong>g <strong>in</strong>novation, research,<br />
and development and contribut<strong>in</strong>g substantively to<br />
technological progress. One measure <strong>of</strong> this contribution<br />
is <strong>the</strong> issuance <strong>of</strong> patents. <strong>The</strong> United States issues far more<br />
18 Report <strong>of</strong> <strong>the</strong> APA Presidential Task Force on <strong>Immigration</strong>